Figures & data
Table 1 Comparison of Basic Data of Patients with Different Prognosis
Table 2 Comparison of Curative Effects of Patients with Different Levels of Basic PTEN n/%
Figure 1 Expression of PTEN in HF patients. ***P<0.001.
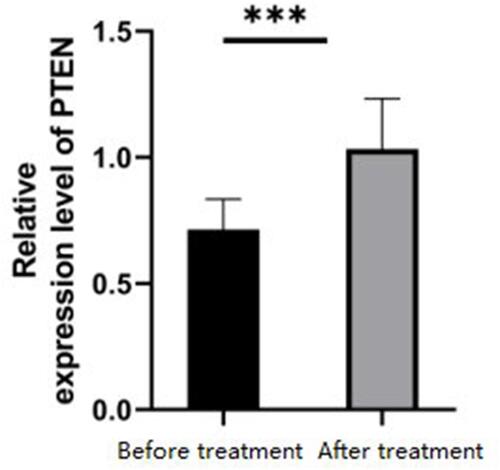
Table 3 Comparison of Basic Echocardiographic Parameters in Patients with Different Prognosis
Figure 2 Echocardiographic parameters in HF patients. (A–D) Measurement of LVEF, SV, E/A and LVFS parameters in HF patients under echocardiography. **P<0.01, ***P<0.001.
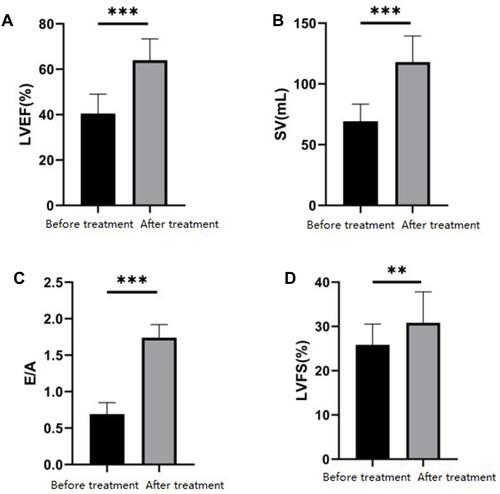
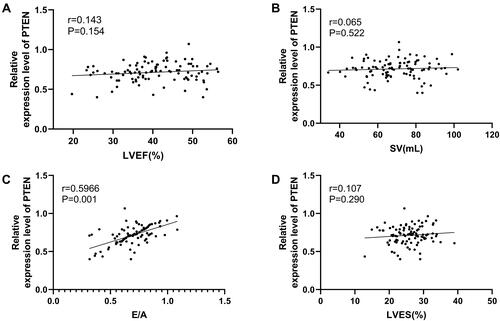
Figure 3 Correlation between PTEN and echocardiographic parameters. (A) Correlation analysis of serum PTEN relative level and LVEF in HF patients. (B) Correlation analysis of serum PTEN relative level and SV in HF patients. (C) Correlation analysis of serum PTEN relative level and E/A in HF patients. (D) Correlation analysis of serum PTEN relative level and LVES in HF patients.