Figures & data
Figure 1 Identification of DEGs. (A and B) Heatmaps of top 20 up- and downregulated DEGs between the OLP samples and normal samples in datasets GSE38616 and GSE52130. Red rectangles represent high expression, and blue rectangles represent low expression. (C and D) Volcano plot of DEGs between the OLP samples and normal samples in datasets GSE38616 and GSE52130. The red plots represent upregulated genes, the blue plots represent downregulated genes, and the black plots represent nonsignificant genes. (E) Venn diagram of DEGs between the OLP samples and normal samples in datasets GSE38616 and GSE52130. Up represents upregulated genes, and down represents downregulated genes.
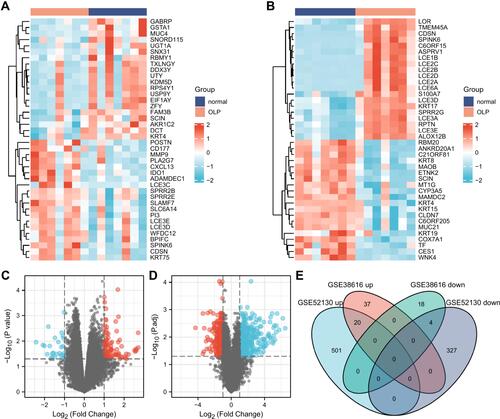
Figure 2 Functional enrichment analysis and PPI network of the common DEGs. (A) GO and KEGG pathway enrichment analysis of the DEGs in common between GSE38616 and GSE52130. The screening criterion for significance was p < 0.05. (B) Interaction network of proteins encoded by the common DEGs. The nodes represent genes, and the edges represent links between genes. Red represents upregulated genes, and blue represents downregulated genes. (C) The one key module extracted by MCODE.
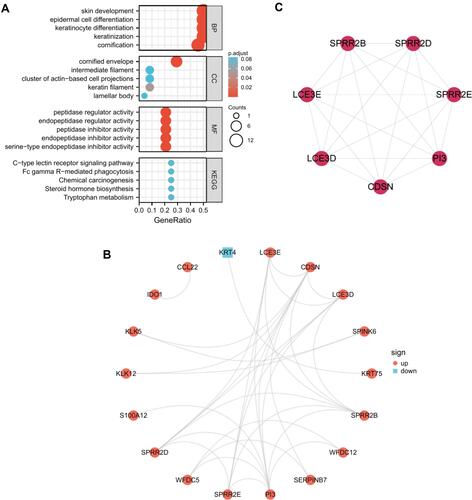
Figure 3 Identification and validation of key genes in OLP malignancy. (A) Venn diagram of the DEGs significantly associated with OLP malignancy; “common up” and “common down” represent upregulated and downregulated DEGs in common for GSE38616 and GSE52130 datasets; “up tendency” and “down tendency” represent genes showing continuous upregulation and downregulation patterns from normal tissue to OLP to OSCC in GSE70665. (B) Expression of KRT75, PI3, S100A12 and FAM3B in OSCC (TCGA, unpaired samples). *p < 0.05; ***p < 0.001; (C) Expression of KRT75, PI3, S100A12 and FAM3B in OSCC (TCGA, paired samples). *p < 0.05; ***p < 0.001; NS, not significant. (D) IHC staining of OSCC and normal oral mucosa from HPA project. Scale bar = 200μm. (E) ROC curve for FAM3B.
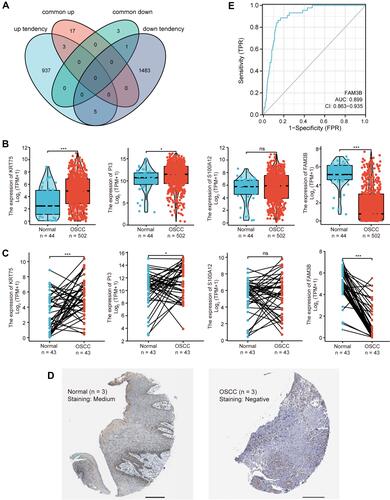
Figure 4 Oncomine analysis comparison on the expression of KRT75, PI3, and FAM3B.
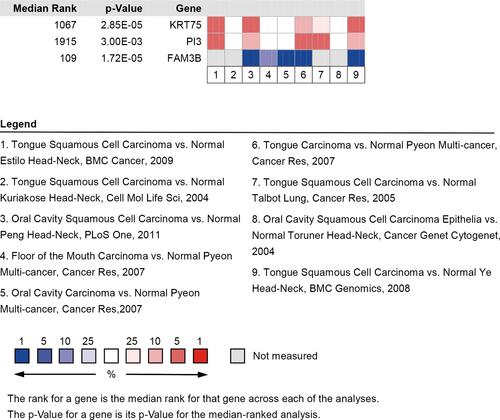
Figure 5 Associations of FAM3B expression with clinical pathological characteristics of OSCC. (A–D) FAM3B expression was significantly correlated with tumor TNM stages, smoking status, and ethnicity. *p < 0.05; **p < 0.01; ***p < 0.001; (E) Correlations between FAM3B expression and immune infiltration.
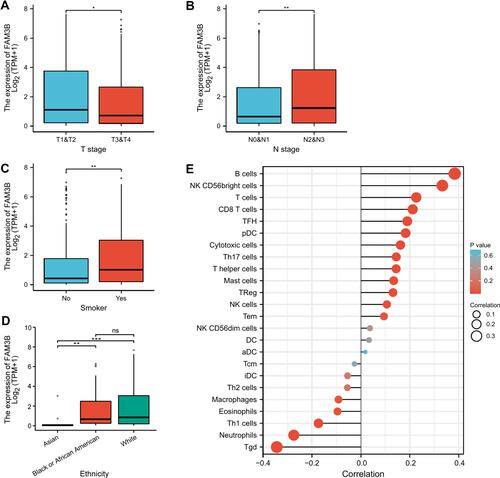
Table 1 Twenty-Four DEGs Common to the GSE38616 and GSE52130 Datasets
Table 2 Enriched Terms for 24 Common DEGs
Table 3 Correlations Between FAM3B Expression in OSCC Tissues and Patient Clinical Indicators
Table 4 Univariate Regression of Prognostic Covariates in Patients with OSCC
Table 5 Multivariate Cox Regression Analysis for DSS in Patients with OSCC
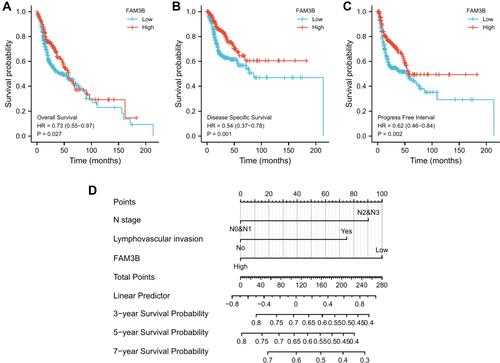
Figure 6 Prognostic value of FAM3B in OSCC patients. (A–C) Univariate survival analysis of FAM3B was performed using Kaplan-Meier curves. (D) Nomogram predicting 3‐, 5‐, and 7‐year DSS for OSCC patients in TCGA cohorts.