Figures & data
Figure 1 The mRNA level of immune checkpoints in KIRC. The graph shows the mRNA level of immune checkpoints in HCC tissues compared with normal tissues. **P < 0.01, ***P < 0.001.
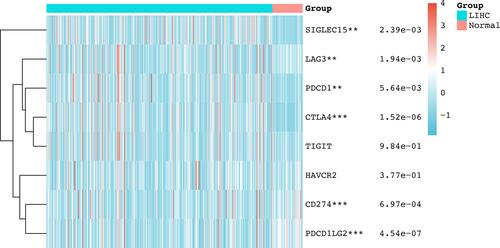
Figure 2 Cancer hallmark of immune checkpoints in HCC. (A and B) Oncoplot displaying genetic mutation landscape of immune checkpoints in TCGA HCC cohort. (C) The activation or inhibition of immune checkpoints in famous cancer-related pathways. (D) Correlation analysis between each member of immune checkpoints. (E) The correlation between immune checkpoints and drug or small molecules. The positive correlation means that the gene high expression is resistant to the drug, vise verse. *P < 0.05, **P < 0.01.
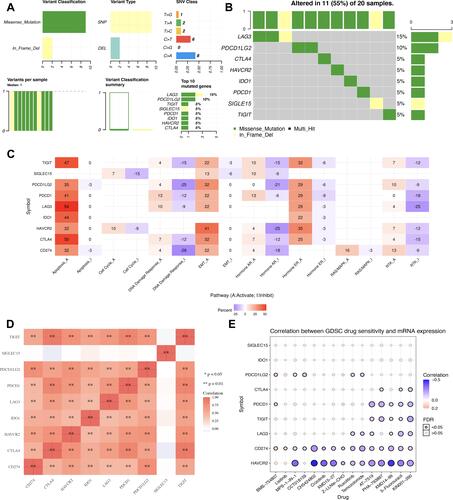
Table 1 Prognosis Value of Immune Checkpoints in STAD for Overall Survival and Recurrence-Free Survival
Table 2 Prognosis Value of Immune Checkpoints in STAD for Progression Free Survivial and Disease-Specific Survival
Figure 3 The prognosis analysis of immune checkpoints in HCC. (A) Survival curve of HCC patients with high and low PDCD1 expression in overall survival, recurrence-free survival, progression free survival, and disease-specific survival analysis. (B) Survival curve of HCC patients with high and low PDCD1LG2 expression in overall survival, recurrence-free survival, progression free survival, and disease-specific survival analysis.
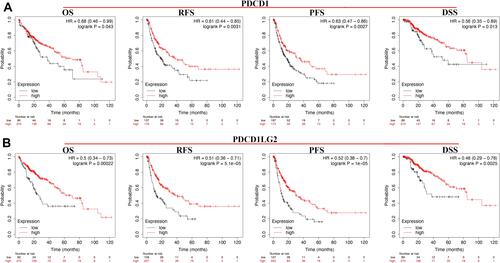
Figure 4 Univariate and multivariate cox regression of immune checkpoints in HCC. (A and B) Univariate and multivariate cox regression of clinical parameters and immune checkpoints in HCC. (C and D) The predictive nomogram to predict the 1-y, 3-y and 5-y overall survival of HCC patients.
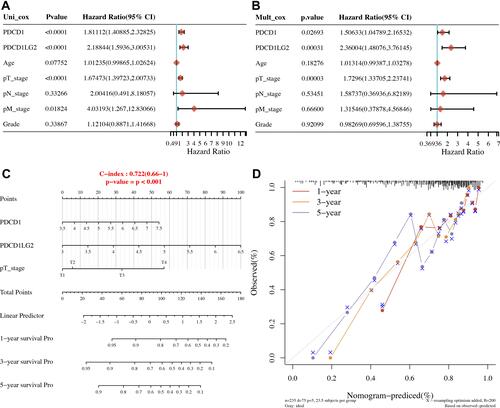
Figure 5 The protein expression of PDCD1/PDCD1LG2 in HCC and normal liver tissues. (A) The protein expression of PDCD1 in HCC and normal liver tissues. (B) The protein expression of PDCD1LG2 in HCC and normal liver tissues.
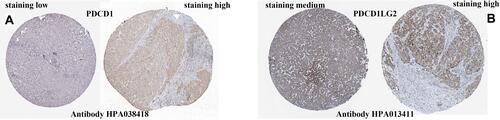
Figure 6 Validation of the expression and overall survival of PDCD1 and PDCD1LG2 in HCC. (A and B) The mRNA level of PDCD1 was upregulated while the mRNA level of PDCD1LG2 was downregulated in HCC versus liver tissues. (C and D) HCC patients with high PDCD1 and PDCD1LG2 expression had a better overall survival. (E and F) Univariate and multivariate analysis demonstrated PDCD1, PDCD1LG2 and clinical stage as prognosis factor affecting the OS of HCC patients. ***P < 0.001.
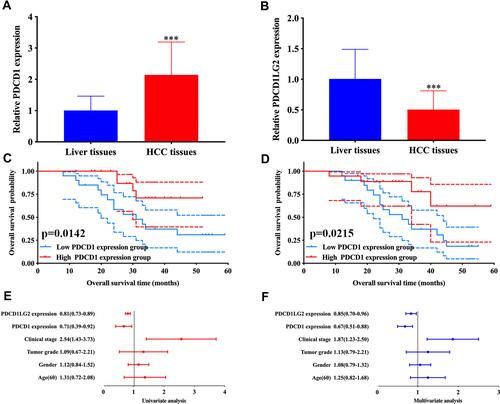
Table 3 Correlation Analysis Between PDCD1/PDCD1LG2 and Gene Biomarkers of Immune Cells in LIHC
Figure 7 The correlation between immune checkpoints and immune infiltration in HCC. (A and B) The correlation between the expression of PDCD1/PDCD1LG2 and the abundance of CD8+ T cells, CD4+ T cells, Macrophage, Neutrophils and Dendritic cells. (C and D) The correlation between SCNA of PDCD1/PDCD1LG2 and immune cell infiltration. (E and F) The correlation between the expression of PDCD1/PDCD1LG2 and chemokine and chemokine receptor expression. *P < 0.05, ** P < 0.01, ***P < 0.001.
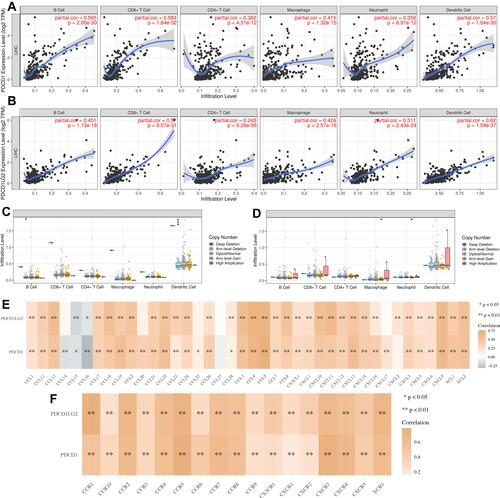
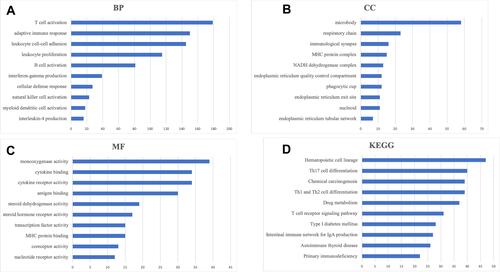
Figure 8 Functional enrichment analysis of PDCD1 HCC. (A) The enriched item in biological processes analysis. (B) The enriched item in cellular components analysis. (C) The enriched item in molecular functions analysis. (D) The enriched item in Kyoto Encyclopedia of Genes and Genomes analysis.