Figures & data
Table 1 Clinicopathologic Features of 140 Patients with Non-Small Cell Lung Cancer
Figure 1 Expression of SIDT1 in tumor tissues and para-tumor tissues. In 60 pairs of tissues, SIDT1 was more highly expressed in tumor tissues than in para-tumor tissues, and the mean score of lung cancer tissues was 1.95-fold higher than normal lung tissues (A) no staining, (B) Para-tumor tissues, (C) Weak staining,(D) Moderate staining, (E) Strong staining, (F) SIDT1 was mainly expressed in the cell membrane and cytoplasm of tumor cells. Magnification, x200. ****P value < 0.001.
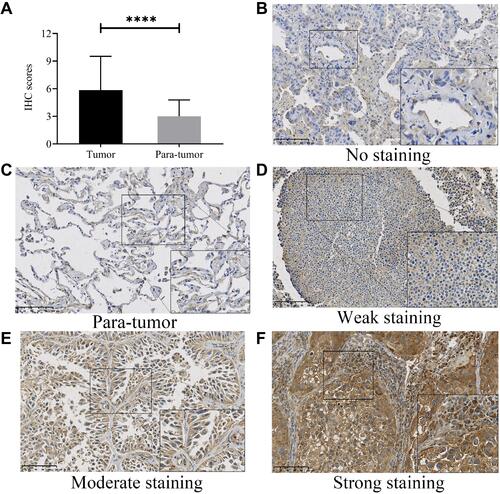
Figure 2 Immunohistochemical staining images of SIDT1 in NSCLC and adjacent lung tissues. In the quantitative score of SIDT1 immunohistochemistry (A) adjacent lung tissues, (B) breast cancer, (C) LUAD, (D) LUSC, (E) SIDT1 expression was higher in tumor cells than in normal adjacent lung tissues. Magnification, x200.
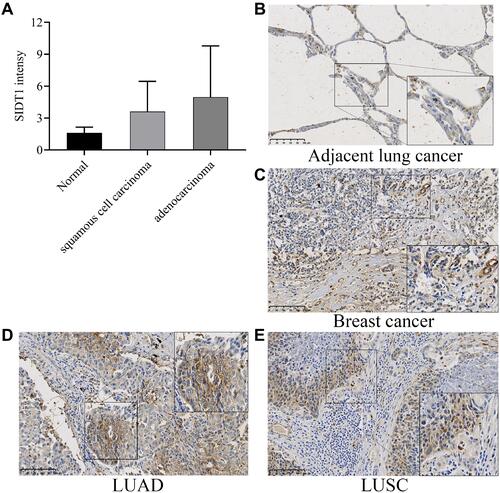
Table 2 The Correlation Between SIDT1 Expression and Clinicopathologic Features in Patients with NSCLC
Table 3 Multivariate Cox Regression Analysis for Potential Factors Influencing Overall Survival in LUAD
Figure 3 Survival curves for Kaplan-Meier survival analysis of overall survival by SIDT1 expression. High expression of SIDT1 is associated with poorer prognosis in NSCLC patients (A) especially in stage I patients, (B) LUAD, (C) and LUSC, (D).
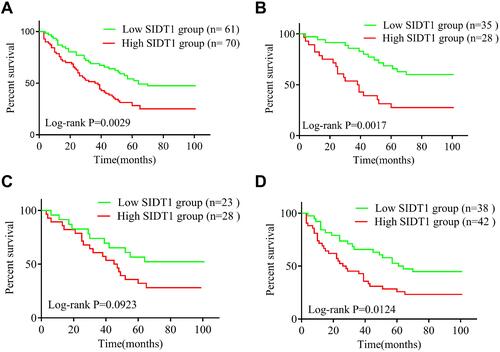
Figure 4 (A) Correlation between 22 immune cells. (B) Violin plot showing the difference in 22 immune cell distributions between the high and low SIDT1-expressing groups in the cohort. ***P value < 0.001, ns means no significant difference.
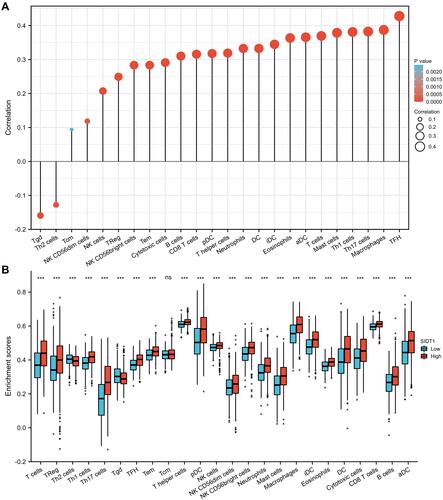
Figure 5 (A) Correlation of SIDT1 expression levels with B cells, CD8T cells, CD4T cells, macrophages, neutrophils and dendritic cells in NSCLC. (B) Cumulative survival rates of B cells, CD8T cells, CD4T cells, macrophages, neutrophils and dendritic cells in NSCLC.
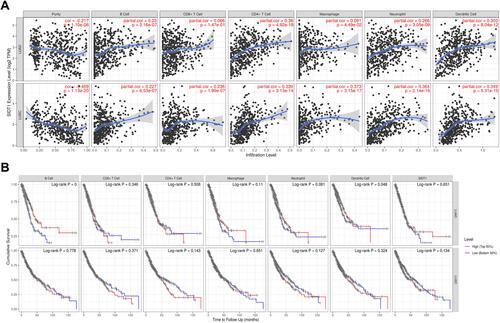
Figure 6 (A–C) Enrichment analysis of co-expressed genes. (D–I) GSEA results show differential enrichment between high SIDT1 expression and low SIDT1 expression.
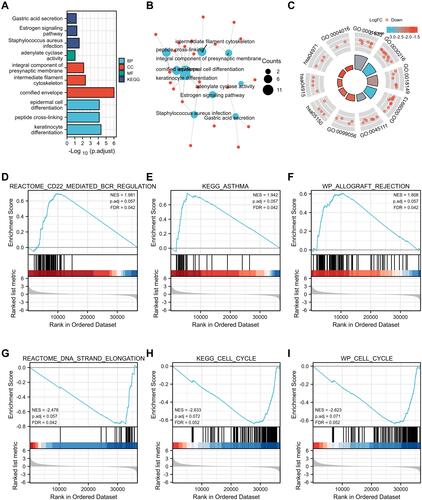
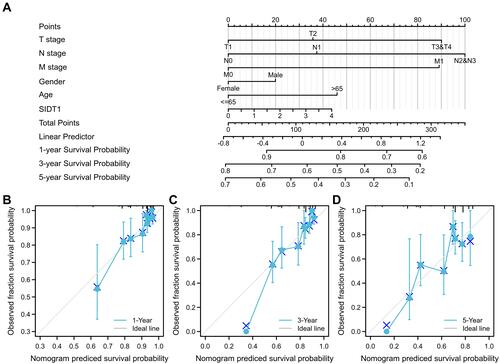
Figure 7 (A) Line graph of NSCLC prognostic model. (B–D) NSCLC prognostic model 1-year and 3-year 5-year calibration curves.