Figures & data
Figure 1 Activity of NF-κB signaling braches in LGG and their impact on survival outcome. (A) Box plots of normalized expression of core member genes of NF-κB signaling in LGG (red) and in healthy tissue (grey). Fold change and statistical significance were asterisked above (Mann–Whitney U-test, ***p<0.001). (B) Correlation between expression of core members of NF-κB signaling and activity of non-canonical NF-κB. (C) Kaplan-Meier curve of non-canonical NF-κB signaling.
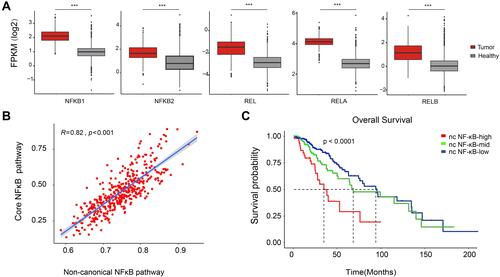
Figure 2 Genomic characteristics of LGG across non-canonical NF-κB groups. Mutation types were color marked. Major clinical information, genomic, epigenetic landmarks and pathological type were labeled on the top. Population frequency of each mutated gene was shown at left side.
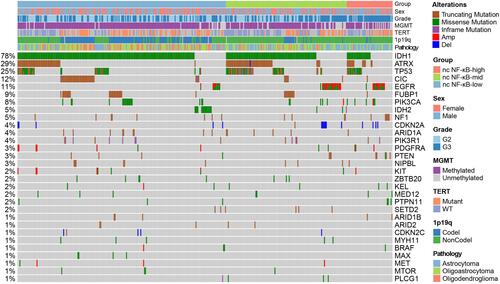
Figure 3 Immune cell infiltration of LGG samples. (A) Comparison of immune cell infiltration between non-canonical NF-κB signaling groups. (B–D) Comparison of cytotoxic T cells, exhausted T cells and macrophage infiltration between non-canonical NF-κB groups. (E and F) Heatmap of macrophage M2 marker gene expression and immune checkpoint expression in each non-canonical NF-κB signaling groups. (G–I) Comparison of TMB, IPS and GEP score between non-canonical NF-κB signaling groups. Statistical significance between groups was asterisked to the top (Kruskal–Wallis test; *p<0.05, **p<0.01 and ***p<0.001).
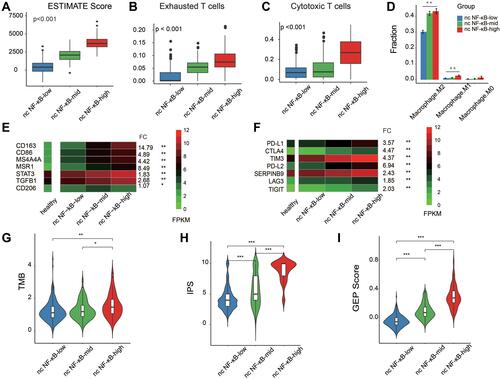
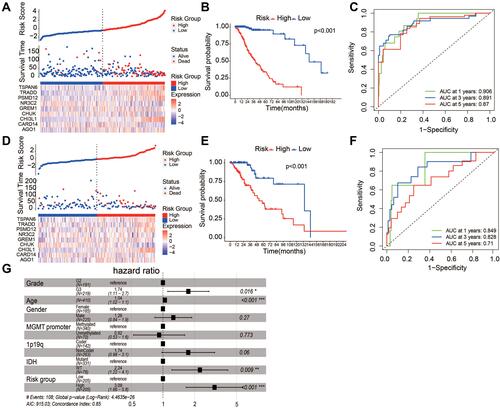
Figure 4 Prognostic model of LGG. (A) Prognostic analysis of non-canonical NF-κB groups. LGG patients were divided into low- and high-risk groups based on median risk score. (B) Kaplan-Meier curve showed significant survival difference between low- and high risk groups. (C) ROC curve demonstrated the AUC for predicting patient status. (D–F) Prognostic performance during internal model validation using 137 LGG samples from TCGA. (G) Multivariate Cox model showed Independence of prognostic ability in predicting survival of LGG patients after adjusting known genomic and clinical confounders (*p<0.05, **p<0.01 and ***p<0.001).