Figures & data
Table 1 Clinical Characteristics of ccRCC Patients
Figure 1 SPC24 was significantly overexpressed in ccRCC. (A) SPC24 was significantly upregulated in ccRCC compared to kidney tissues in TCGA database. (B) SPC24 was significantly upregulated in ccRCC compared to kidney tissues in GEO database. (C and D) SPC24 was expressed at higher levels in ccRCC compared to non-cancerous adjacent tissues in TCGA and GEO database. ***P<0.001.
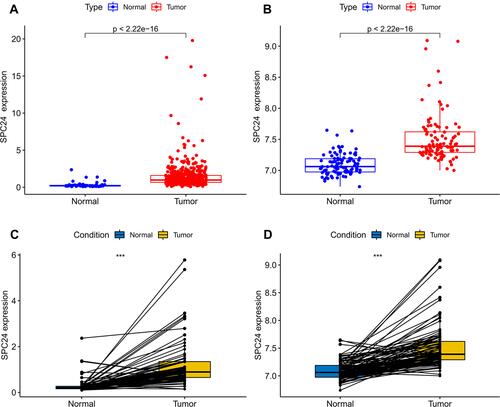
Figure 2 Survival analysis. (A) Correlation between SPC24 expression and OS in TCGA ccRCC patients. (B) Correlation between SPC24 expression and DFS in TCGA ccRCC patients. (C) Correlation between SPC24 expression and PFS in TCGA ccRCC patients. (D) Correlation between SPC24 expression and DSS in TCGA ccRCC patients.
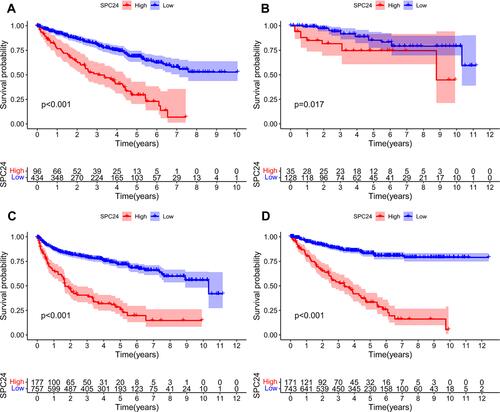
Figure 3 The relationship between the SPC24 expression and clinicopathological variables in TCGA and GEO database. (A) Histological grade in TCGA ccRCC patients; (B) Pathological stage in TCGA ccRCC patients; (C) T stage in TCGA ccRCC patients; (D) N stage in TCGA ccRCC patients; (E) M stage in TCGA ccRCC patients; (F) Histological grade in GEO ccRCC patients.
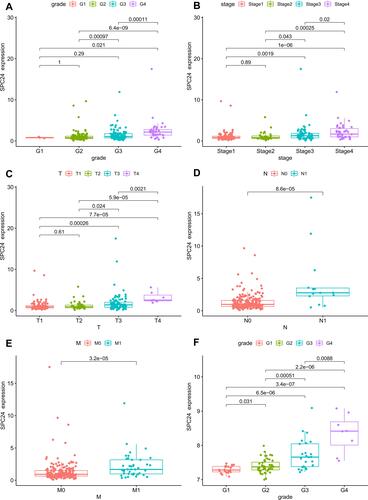
Figure 4 Univariate Cox regression and multivariate Cox regression analysis. Forest plot based on univariate (A) and multivariate (B) Cox regression analysis of OS in TCGA database.
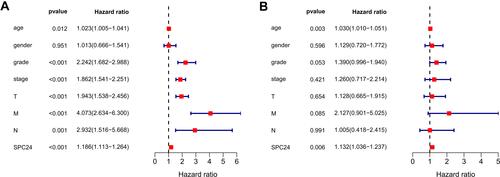
Figure 5 Nomogram for the prediction of outcome in patients with ccRCC. (A) The nomogram could predict 1-, 3- and 5- years OS of ccRCC patients. The calibration curve analysis showed that the actual and the predicted 1-(B), 3-(C), and 5-year (D) survival times were consistent when compared with the reference line.
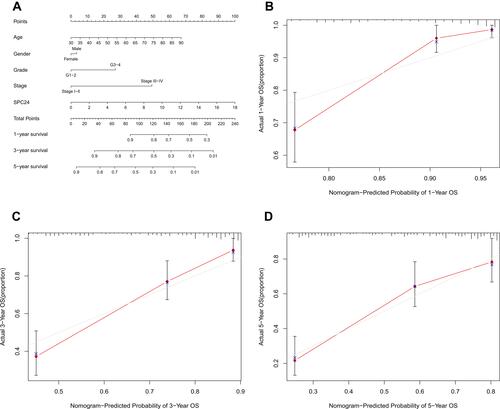
Figure 6 SPC24 is highly up-expressed in ccRCC cell lines. Relative SPC24 expression in ccRCC cell lines (OSRC, 786O) compared with normal cell line (HK2) by RT-qPCR analysis. *P<0.05, **P<0.01.
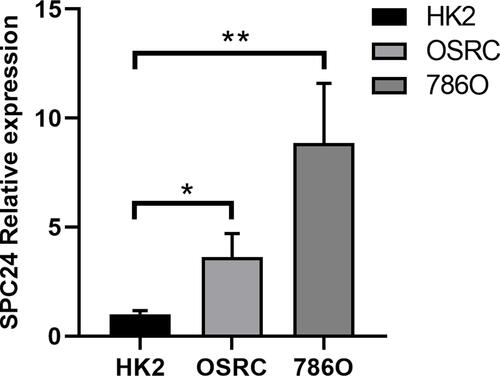
Figure 7 Enrichment plots from gene set enrichment analysis (GSEA). Each line representing one particular gene set with unique color, and up-regulated genes located in the left approaching the origin of the coordinates, by contrast the down-regulated lay on the right of x-axis. Only gene sets with NOM p<0.05 and FDR<0.06 were considered significant. (A) The enriched gene sets in MSigDB Collection (c2.cp.kegg.v6.2.symbols.gmt) by the high SPC24 expression patients. (B) The enriched gene sets in MSigDB Collection (c2.cp.kegg.v6.2.symbols.gmt) by samples with low SPC24 patients. (C and D) GSEA indicated significant enrichment of immune-related phenotype in the high SPC24 expression patients.
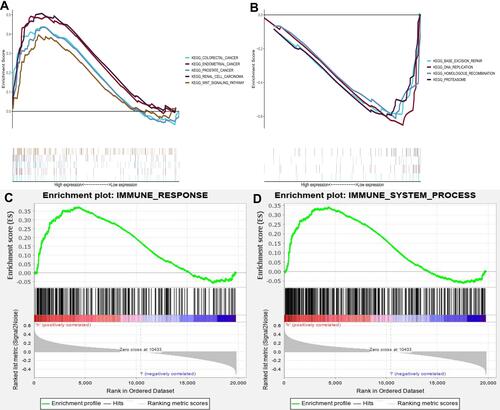
Figure 8 Immunocytes infiltrated profile in tumor patients and correlation analysis. Barplot showing the proportion of 21 kinds of immunocytes infiltrated in ccRCC tumor patients. The listing of plot represents the patient ID.
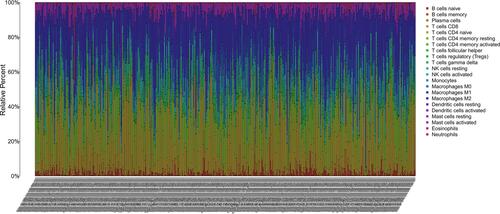
Figure 9 The plot showed the ratio differentiation of 21 kinds of immune cells between ccRCC samples with low or high SPC24 expression relative to the median of SPC24 expression level.
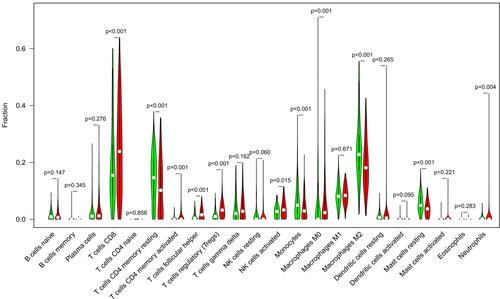
Figure 10 Scatter plot showed the correlation of 12 kinds of immunocytes infiltrated proportion with the SPC24 expression.
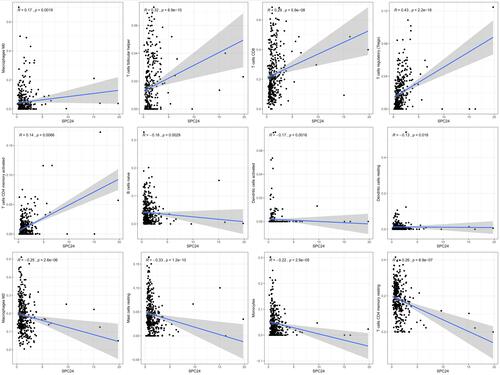
Figure 11 The difference of SPC24 expression between tumor and corresponding normal tissues in 32 cancer types. *P<0.05, **P<0.01, ***P<0.001.
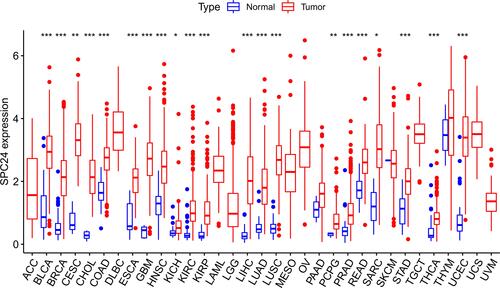
Figure 12 High SPC24 expression patients were significant related to short OS in ACC (A), KIRP (B), LIHC (C), LUAD (D), MESO (E), and PAAD (F).
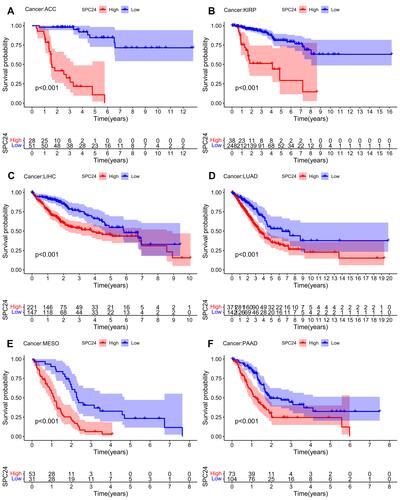
Figure 13 High SPC24 expression groups PFS were worse than that of low SPC24 expression groups in ACC (A), KIRP (B), LIHC (C), LUAD (D), MESO (E), and PAAD (F).
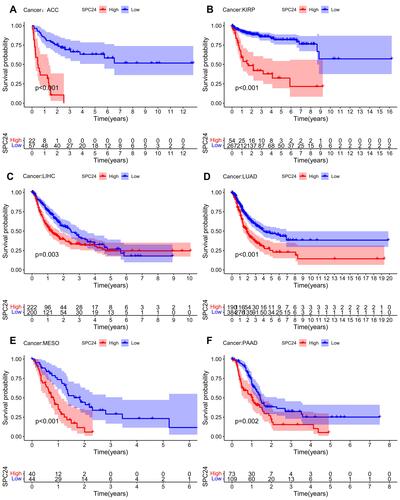
Figure 14 The relationship between the expression SPC24 and pathological stage in pan-cancer data. ACC (A), KIRP (B), LIHC (C), LUAD (D), MESO (E), and PAAD (F).
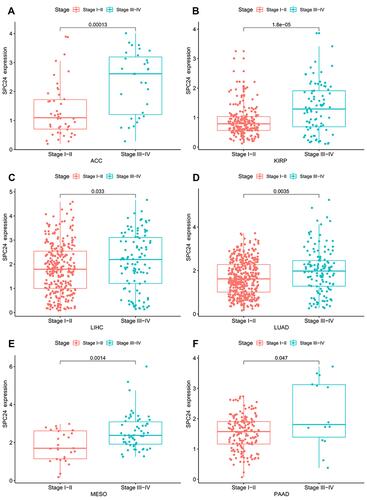
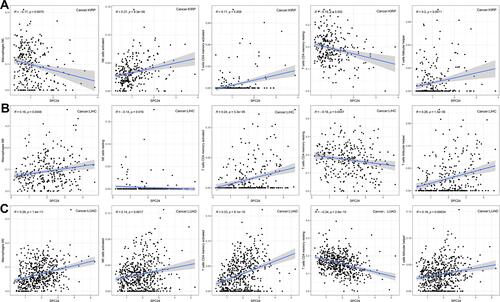
Figure 15 Correlation between SPC24 expression and infiltration level of five common-type immune cells (CD4 memory resting T cells, CD4 memory activated T cells, Follicular helper T cells, NK cells and Macrophages). (A) Correlation between five immune cells infiltration level and SPC24 expression in KIRP. (B) Correlation between five immune cells infiltration level and SPC24 expression in LIHC. (C) Correlation between five immune cells infiltration level and SPC24 expression in LUAD.