Figures & data
Table 1 Demographic, Anthropometric and Clinical Characteristics of the Osteoporosis and Non-Osteoporosis Individuals
Figure 1 The proportion of various T-score in men aged ≥50 and postmenopausal women. Participants were grouped by BMD T-score: normal (T ≥−1), low bone mass (−2.5 < T <−1), osteoporotic (−3 ≤ T ≤−2.5), and very low bone mineral density (T <−3). (A) is the incidence of each group based on various T-score in men aged ≥50. (B) is the incidence of each group based on various T-score in postmenopausal women.
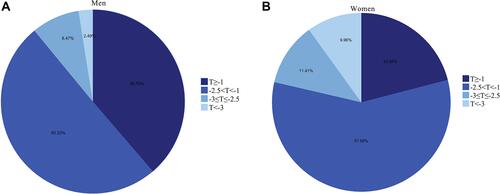
Table 2 Associated Factors for Very High Fracture Risk (T-Score <−3) in the Study Population with Calculation of Odds Ratio (OR), Adjusted OR and Corresponding 95% Confidence Interval (95% CI)
Figure 2 Prediction model nomogram. For each variable, the patient’s status/numerical value is plotted on the unique scale for that variable and a vertical line is drawn from that location up to the points line to determine a points value for that variable. The points for all variables are then added for a total point score. From the location of the total value on the total points line on the bottom, a vertical line is drawn perpendicularly from that location down to the probability of goal attainment line. The probability of very low bone mineral density (T-scores <-3) for the patient is predicted according to the value at which the vertical line intersects the probability of very low bone mineral density (T-scores <-3). Example: Mrs. X, 70 years old, weighs 50 kg; her score for age is approximately 15, her weight score is 77.5. Her total score is therefore 15+77.5=92.5, and her probability of having very high fracture risk is around 0.25. In other words, in 100 women like her, one would expect 25 of them have very low bone mineral density (T-scores <-3).
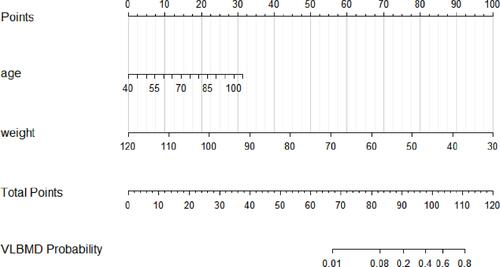
Figure 3 The calibration curves of the prediction model. The diagonal dotted line indicates reference line on which ideal nomogram would lie (perfect prediction). Solid line indicates current nomogram performance.
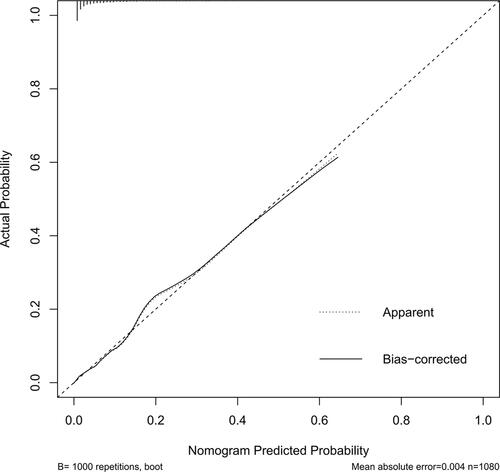
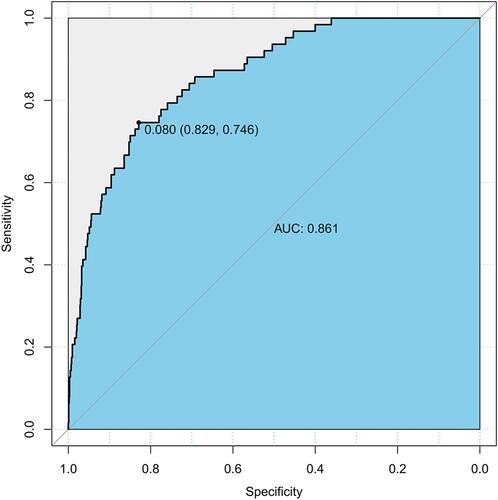
Figure 4 The receiver operating characteristic (ROC) curves of the prediction model.