Figures & data
Figure 1 The flow chart of the study.
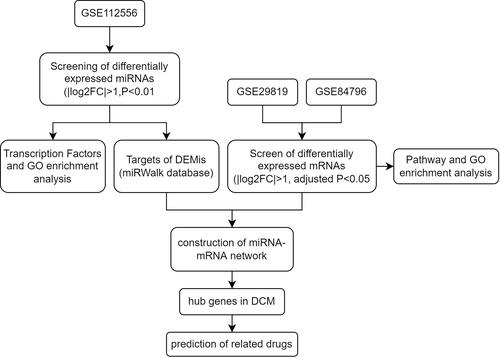
Table 1 Differentially Expressed miRNAs (DEMis)
Figure 2 The screening and functional annotation of DEMis in DCM. (A) The 8 DEMis are shown in the volcano plot (|log2FC| > 1, P-value < 0.01). (B) The heat map shows the expression level of differentially expressed miRNA. (C) The transcription factors enrichment analysis of DEMis in DCM. (D–F) The GO functional annotation of DEMis in DCM.
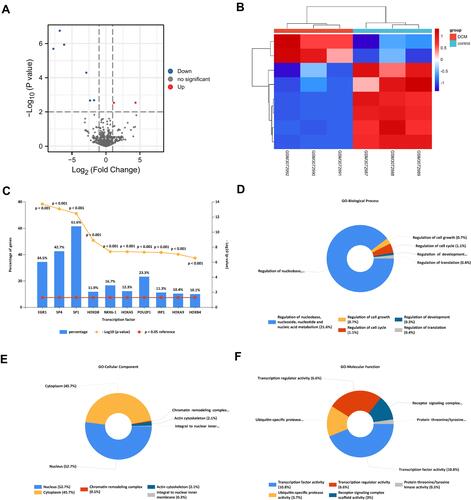
Figure 3 The screening of DEMs in DCM. (A) The volcano plot was drawn to show the 209 up-regulated and 265 downregulated mRNAs in GSE29819 (|log2FC| > 1, adjusted P-value < 0.05). (B) The heatmap shows the expression level of DEMs in GSE29819. (C) The volcano plot was drawn to show the 1059 up-regulated and 398 downregulated mRNAs in GSE84796 (|log2FC| > 1, adjusted P-value < 0.05). (D) The heatmap shows the expression level of DEMs in GSE84796. (E and F) The Venn diagrams were drawn to show the overlapping up-/down-regulated mRNAs between GSE29819 and GSE84796.
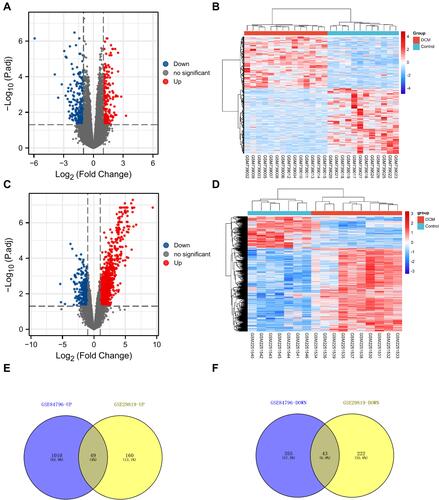
Figure 4 Pathway and GO enrichment analysis of DEMs. (A) The top 10 pathways from the results of KEGG analysis (P < 0.05). (B) The top 10 terms from the results of GO enrichment analysis (P < 0.05).
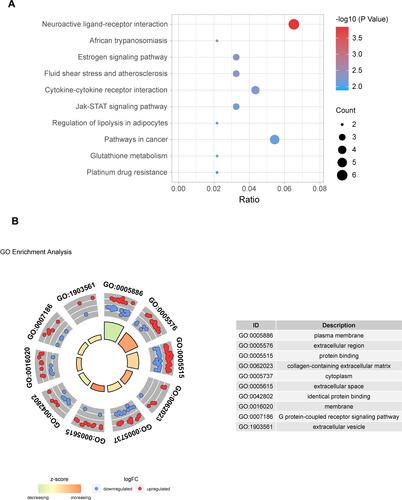
Table 2 The Five Algorithmic Scores of Hub Genes
Figure 5 Construction of miRNA-mRNA network. (A) The network of DEMis and DEMs. (B) The top 10 hub genes from the results of Betweenness algorithms. (C) The top 10 hub genes from the results of Closeness algorithms. (D) The top 10 hub genes from the results of Degree algorithms. (E) The top 10 hub genes from the results of MCC algorithms. (F) The top 10 hub genes from the results of Stress algorithms. (G) The Venn diagram was drawn to show the overlapping hub genes in the results of 5 algorithms.
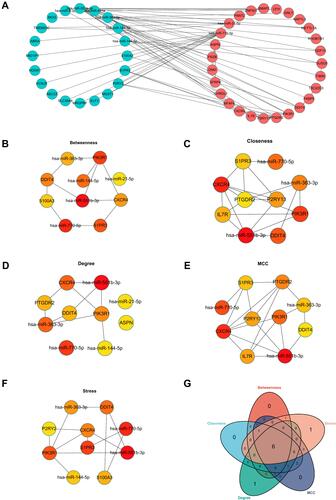
Table 3 Suggested Top 10 Drugs Compounds for the DCM
Figure 6 Prediction of top 10 candidate drugs. (A) The top 10 hub gene-related drugs. (B) The diagram of chemical structure of drugs.
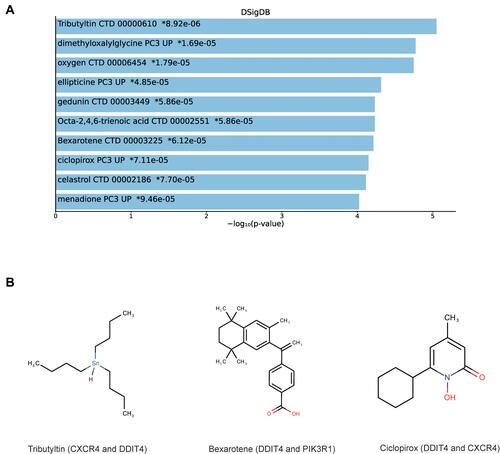
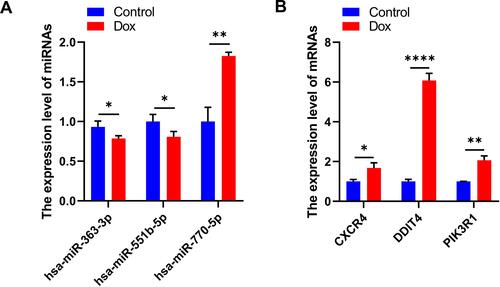
Figure 7 Validation of abnormal hub genes. (A) The expression level of miRNAs (* P < 0.05, ** P < 0.01). (B) The expression level of mRNAs (* P < 0.05, ** P <0.01, **** P < 0.0001).