
Figures & data
Figure 1 Representative samples of immunohistochemical staining of nucleus (A) weak staining; (B) strong staining) and cytoplasm (C) weak staining; (D) strong staining).
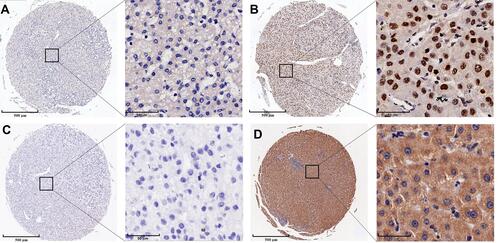
Table 1 Detailed MAPK10 Genetic Mutation Rates in Different Cancers (HCC, Colorectal Cancer, Stomach Cancer, and Pancreatic Cancer) and Age Groups
Figure 2 Survival curves of HCC patients based on MAPK10 and NRF2 expression levels. (A) long-term overall survival curves of high and low MAPK10 expression groups. (B) long-term disease-free survival curves of high and low MAPK10 expression groups. (C) short-term overall survival curves of high and low NRF2 expression groups. (D) short-term disease-free survival curves of high and low NRF2 expression groups. (E) long-term overall survival curves of high and low MAPK10 and NRF2 expression groups.
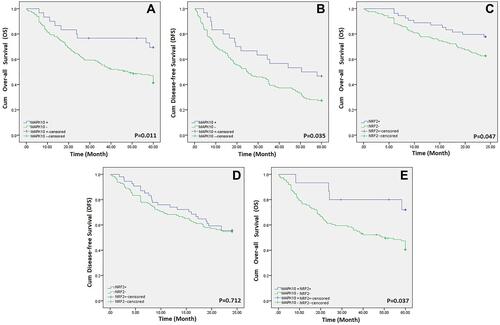
Table 2 Clinical Characteristics of MAPK10 Protein Expression Groups (181 Patients)
Table 3 Clinical Characteristics of NRF2 Protein Expression Groups (181 Patients)