Figures & data
Figure 1 Flow diagram of study selection.
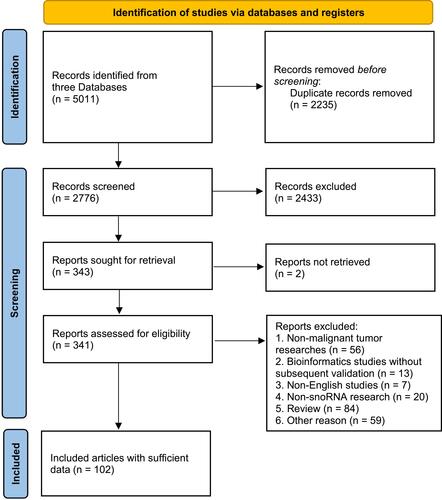
Figure 2 Distribution of articles by cancer types in 15 years.
Abbreviations: NSCLC, non-small cell lung cancer; HCC, hepatocellular carcinoma, ccRCC, clear cell renal cell carcinoma; BC, breast cancer; CRC, colorectal cancer; MM, multiple myeloma; PDAC, pancreatic ductal adenocarcinoma; GC, gastric cancer; PCa, prostate cancer; PTCL, peripheral T-cell lymphoma; HNSCC, head and neck squamous cell carcinoma; ESCC, esophageal squamous cell carcinoma.
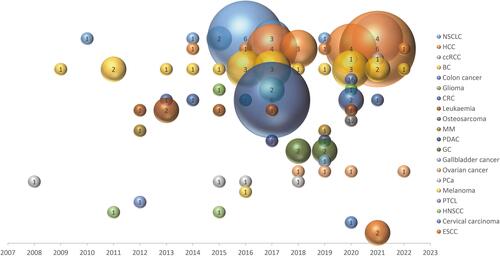
Figure 3 Mind map of included studies by clinicopathological features and by cancer types.
Abbreviations: HCC, hepatocellular carcinoma; PDAC, pancreatic ductal adenocarcinoma; CRC, colorectal cancer; GC, gastric cancer; ESCC, esophageal squamous cell carcinoma; IPMN, intraductal papillary mucinous neoplasm; MCN, mucinous cystic neoplasm; HBV, hepatitis B virus; BCLC stage, Barcelona clinic liver cancer stage; PVTT, portal vein tumor thrombus; CEA, carcinoembryonic antigen; ER, estrogen receptor.
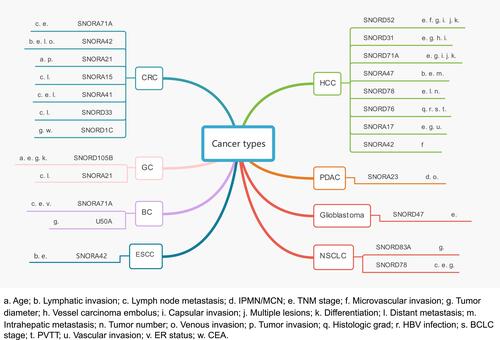
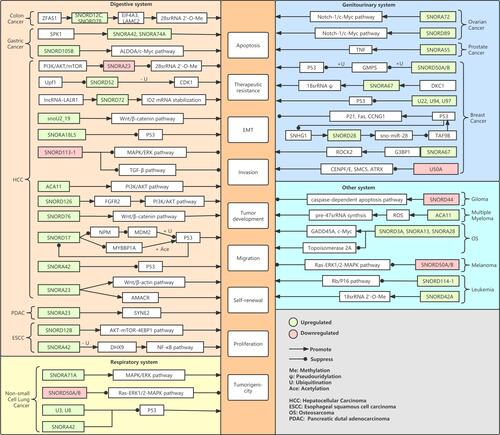
Figure 4 Heatmap of the cell gene function research.
Abbreviation: EMT, epithelial–mesenchymal transition.
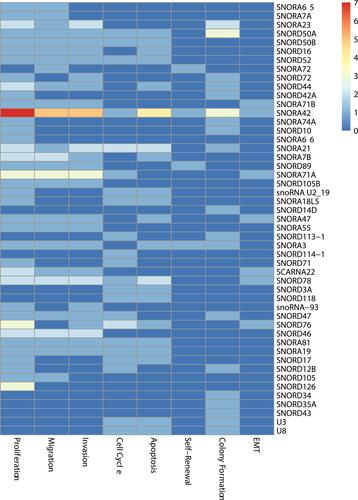
Figure 5 Bubble plot of included studies by prognosis and by tumor system.
Abbreviations: OS, overall survival; DFS/RFS, disease-free survival/recurrence-free survival.
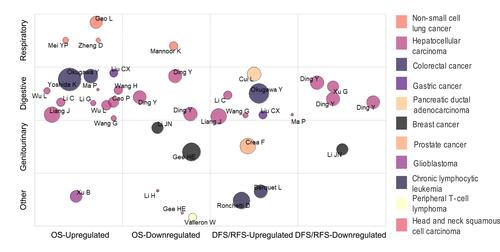
Figure 6 snoRNAs related signaling pathway.