
Figures & data
Figure 1 Screening candidate methylated markers. (A) Evaluation of random forest model with multidimensional scaling chart. (B) Variable importance for top 30 predictors. (C and D) Thirteen methylation markers identified by LASSO regression analysis and the cross-validation performed to prevent overfitting.
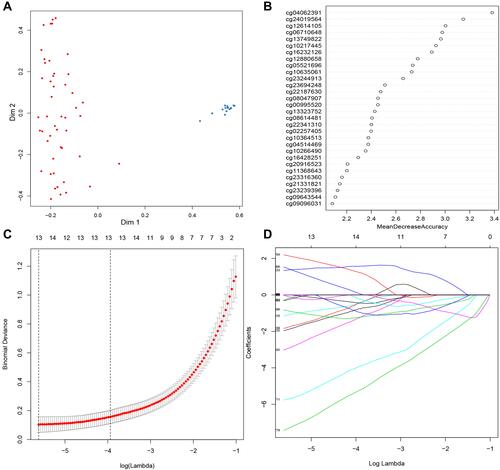
Figure 2 Alterations of DNA methylation in CC. (A) Five overlapping aberrant methylation markers selected by LASSO-based and random forest-based analysis. (B) Regional hypermethylation and global hypomethylation are present in cancer cells. Regional hypermethylation (aberrant DNA methylation) indicates increased DNA methylation of CpG islands unmethylated in normal cells (demonstrated in red dotted boxes).
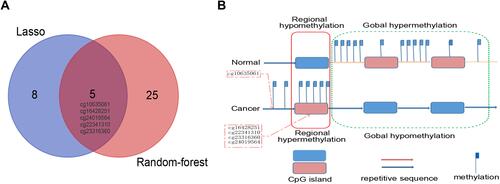
Figure 3 Performance of the DNA methylation diagnostic based on random forest (RF) classifier. (A) Unsupervised hierarchical clustering of five methylation markers selected for predicting the status of training dataset. (B) Predicting the status of testing dataset.
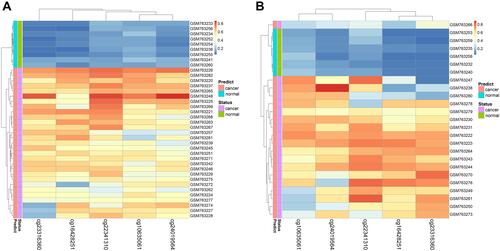
Figure 4 Boxplot presenting the beta value distribution of the five markers in six independent datasets. (A) GSE30759, (B) GSE30760, (C) GSE41384, (D) GSE46306, (E) GSE99511, (F) TCGA. (ns not significant, *P < 0.05; **P < 0.01; ***P < 0.001; ****P < 0.0001).
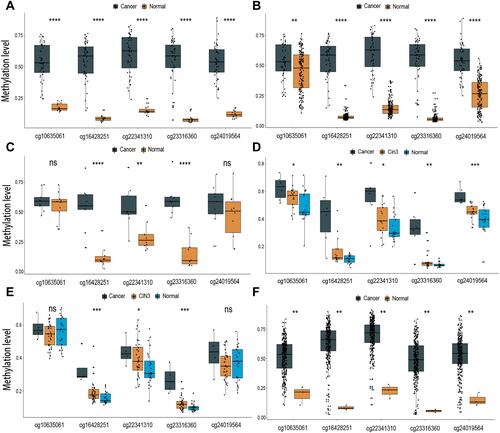
Figure 5 Performance of the DNA methylation diagnostic markers in CC prediction evaluated by ROC. (A) GSE30759, (B) GSE30760, (C) GSE41384, (D) GSE46306, (E) GSE99511, (F) TCGA.
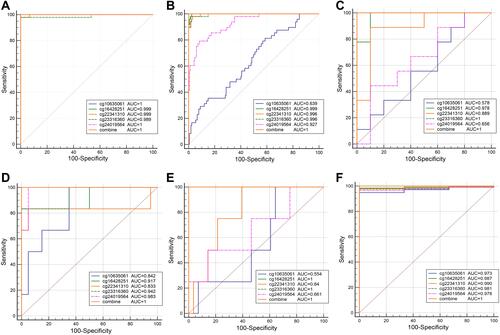
Figure 6 The diagnosis efficiency of DNA methylation diagnostic markers in CIN3 prediction. (A) GSE46306, (B) GSE99511.
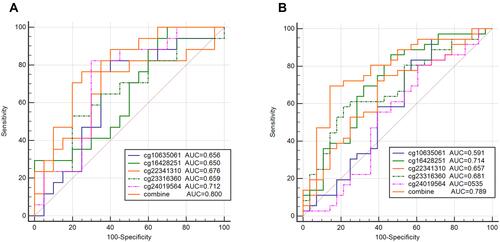
Figure 7 Performance of the DNA methylation prognostic model in the OS prediction of patients with CC. (A) GSE30759, (B) TCGA.
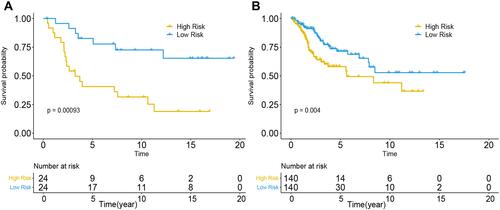
Figure 8 Performance of combinations of the DNA methylation prognostic model and stage in the OS prediction of patients with CC. (A) GSE30759, (B) TCGA.
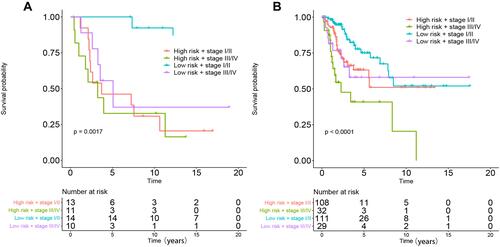
Table 1 Univariate and Multivariate Cox Regression Analyses of the Prognostic Prediction Model in CC Patients