Figures & data
Figure 1 Flow chart for the creation of the included MA and SRCC patient cohort.
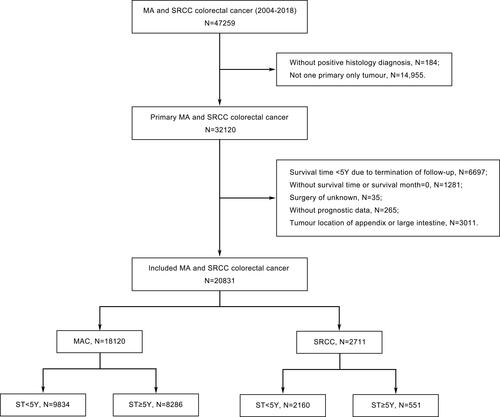
Table 1 Comparation of Clinical Characteristics of Patients with Different Survival Times
Table 2 Prognostic Factors for the OS and CSS in Patients with a Survival Time Longer Than 5 Years by Univariate Analysis
Table 3 Multivariable Cox Regression Analysis of the Prognosis Factors Associated with OS and CSS in Patients with a Survival Time Longer Than 5 Years
Table 4 Multivariable Cox Regression Analysis of the Prognosis Factors Associated with OS and CSS in Patients with ST<5Y
Figure 2 Kaplan-Meier curves for CSS in MA patients with ST<5Y and ST≥5Y.
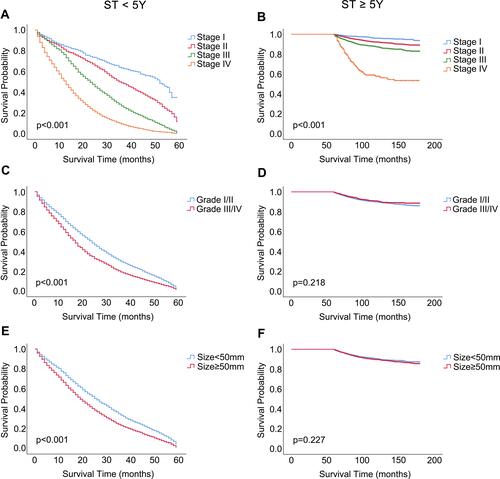
Figure 3 Kaplan-Meier curves for CSS in SRCC patients with ST<5Y and ST≥5Y.
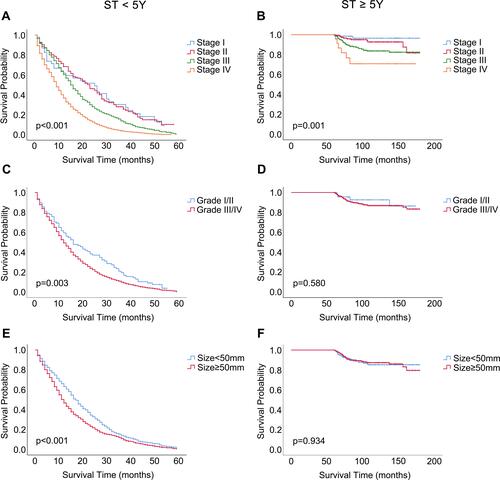
Figure 4 Survival analysis of chemotherapy in MA and SRCC patients with ST<5Y and ST≥5Y.
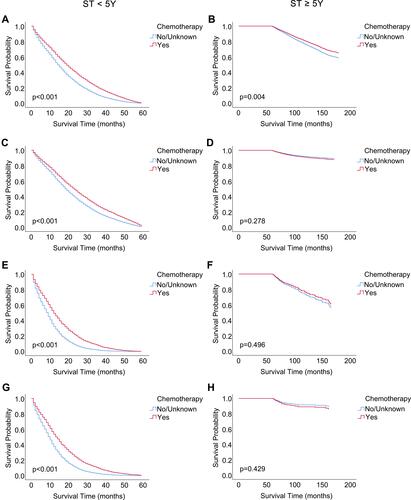
Figure 5 Survival benefit of chemotherapy for MAOS in patients with ST≥5Y.
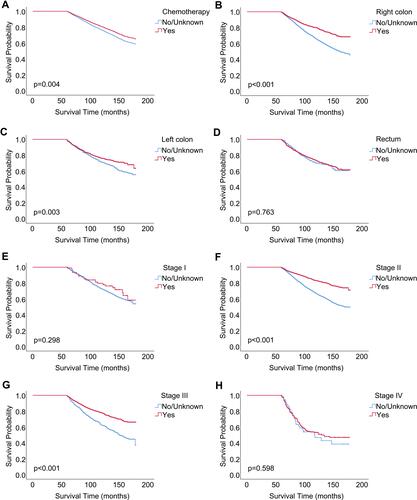
Figure 6 Construction of nomograms to predict the 10-year OS and CSS probability for MA patients with ST≥5Y.
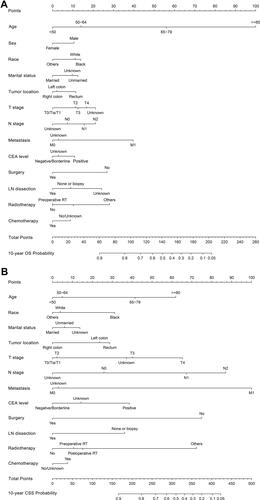
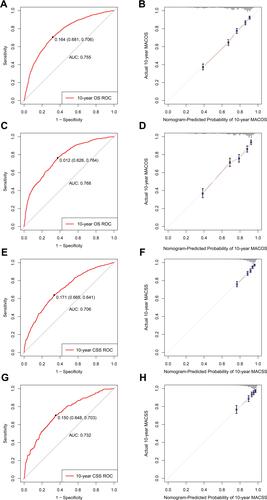
Figure 7 ROC curves and calibration plots of the nomograms for MA patients with ST≥5Y.