
Figures & data
Figure 1 Establishment and verification process of ESR relay internal quality control.
Abbreviation: NHC, National Health Commission of the People’s Republic of China.
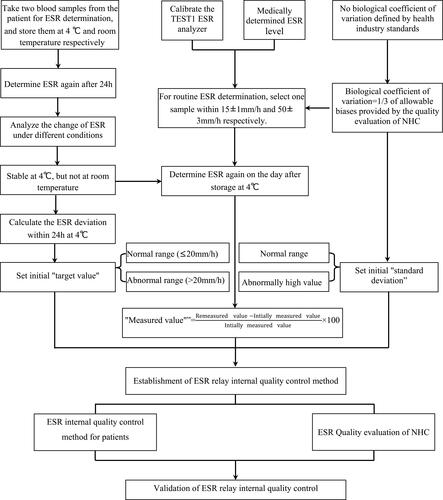
Table 1 Change in ESR of Samples Stored for 24 h at Different Temperatures
Figure 2 Comparison with initial ESR for samples stored for 24 h at different temperatures.
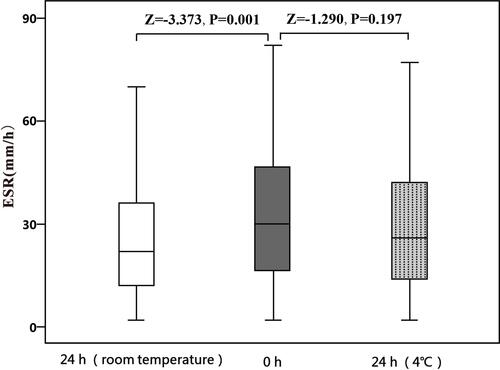
Figure 3 ESR relay internal quality control chart from March 2021.
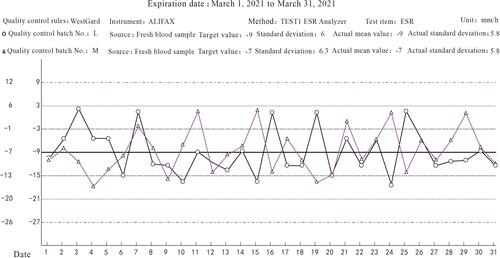
Figure 4 Median ESR for patients from March to July 2021.
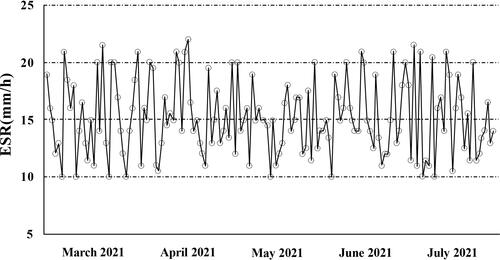
Table 2 Comparison of Median ESR Between Months from March to July 2021
Table 3 EQA Results for ESR Obtained from NCCL (mm/h)