Figures & data
Figure 1 Differential expressed genes (DEGs) selection. (A) Volcano plots of DEGs. Blue indicated downregulated genes and red indicated upregulated genes. (B) Venn analysis for selecting consistent DEGs.
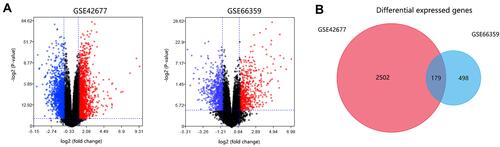
Figure 2 PPI network construction and function analysis on DEGs. (A) PPI network among 179 DEGs. Green indicated DEGs within module 1 and fuchsine indicated DEGs within module 2. (B) The top 5 GO annotation terms. (C) Significant KEGG pathways.
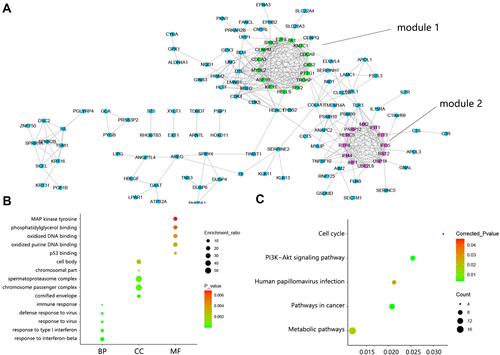
Figure 3 The significant module analysis. (A) DEGs determination within Module 1 and associated KEGG pathways. (B) DEGs determination within Module 2 and associated KEGG pathways.
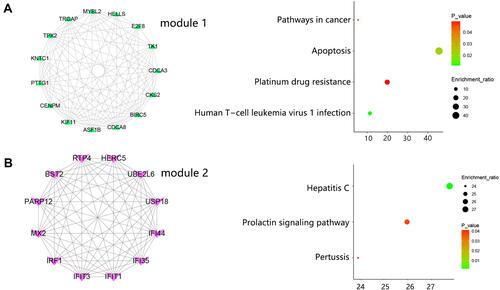
Figure 4 Hub genes determination. (A) Venn analysis for screening the top 10 hub genes. (B) The expression heat map of 10 hub genes between CSCC and normal samples in GSE42677 and GSE66359 datasets. (C) 5 hub genes identification within module 1. (D) The interaction between 5 hub genes within module 1. (E) 5 hub genes identification within module 2. (F) The interaction between 5 hub genes within module 2.
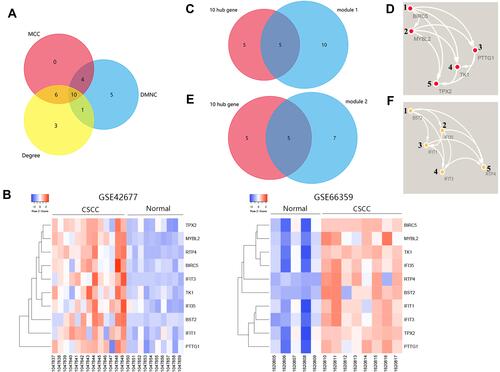
Figure 5 The genetic alteration of 10 hub genes in the dataset of cutaneous squamous cell carcinoma (UCSF, 2021) (83 total samples).
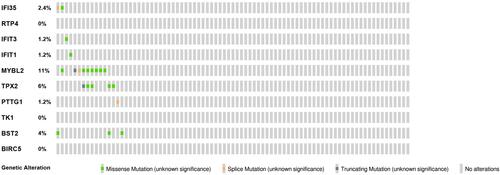
Figure 6 Expression difference of hub genes between actinic keratosis (AK) and normal skin samples in GSE98780.
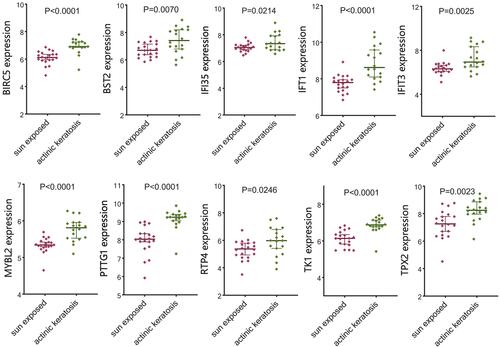
Figure 7 Differential expression of significant hub genes between actinic keratosis (AK) and cutaneous squamous cell carcinoma (CSCC) in GSE45216. Among 10 hub genes, the expression of 4 genes showed no difference between 2 groups.
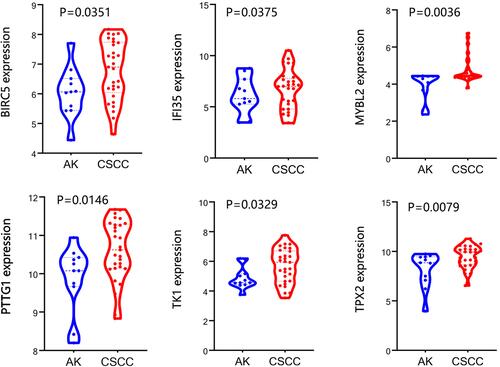
Figure 8 The differential expression of hub genes between cutaneous squamous cell carcinoma (CSCC) samples with or without perineural invasion (PNI) in GSE86544. *P<0.05.
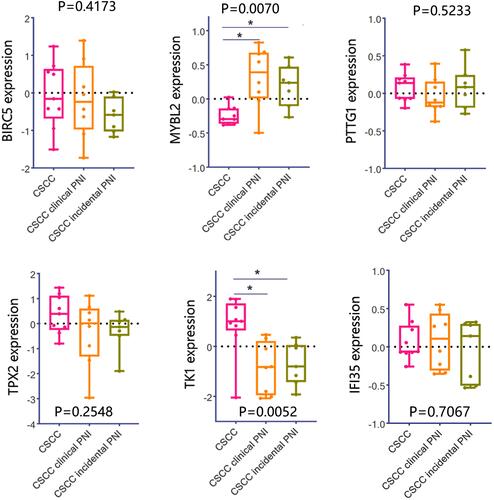
Figure 9 Clinical significance analysis on MYBL2 and TK1 in pan-cancer. (A) Differential expression of MYBL2 and TK1 between tumor and normal samples. (B) Associations between gene expression and overall survival across human cancers.
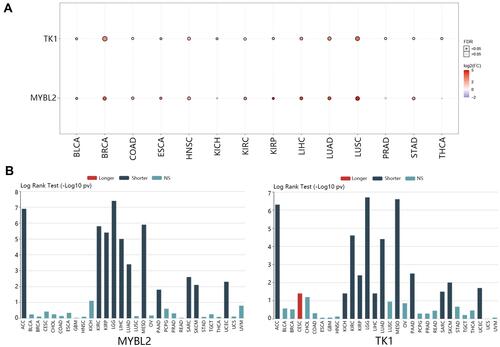
Figure 10 Detailed expression of MYBL2 and TK1 in CSCC. (A) Samples distribution before and after remove batch. The expression profile of GSE66359 and GSE42677 were merged, which contained 15 normal samples and 21 CSCC samples. (B) Differential expression analysis of MYBL2 and TK1. (C) Protein expression of MYBL2 and TK1.
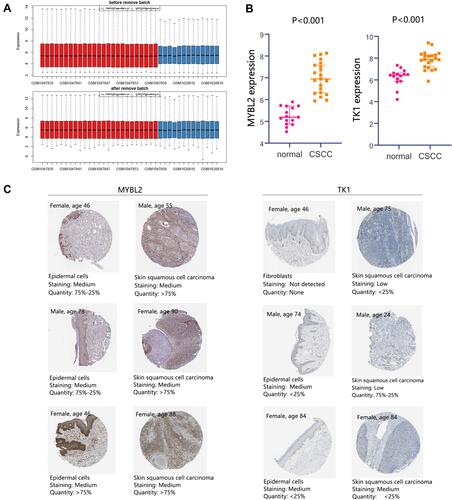
Figure 11 GSEA analysis on MYBL2 and TK1 in CSCC. (A) Sample distribution before and after remove batch. The expression profiles of CSCC samples in GSE42677, GSE66359, and GSE45216 were combined for GSEA analysis. A total of 51 CSCC samples were enrolled. (B) Enriched KEGG terms associated with MYBL2 and TK1.
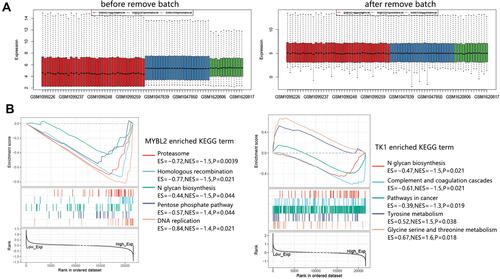
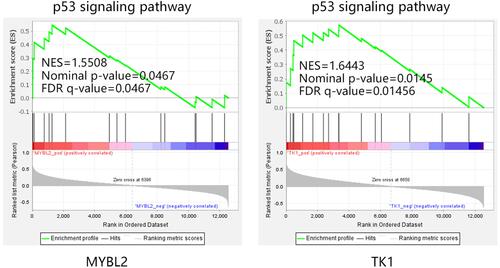
Figure 12 The regulation of MYBL2 and TK1 on p53 pathway in CSCC.