Figures & data
Figure 1 The study design and the selection procession of CAD patients.
Abbreviation: receiver operator characteristic.
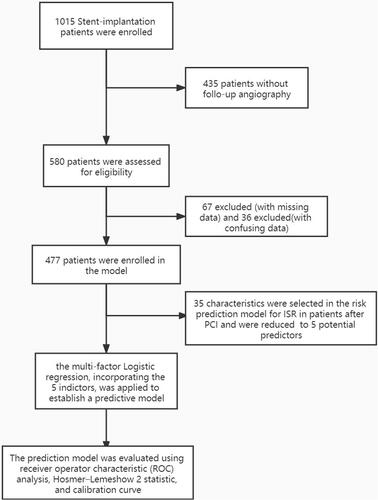
Table 1 The Baseline Characteristics of the Patients
Figure 2 Risk factors selecting using LASSO model.
Notes: (Left panel) Optimal parameter (lambda) selection for the LASSO model was cross validated five the minimum criterion. Partial likelihood deviation (binomial deviation) curves versus log(lambda). Dotted vertical lines are drawn at the best values of 1SE (1-SE criterion) using the minimum criterion and the maximum criterion. (Right) LASSO coefficient profiles for 35 characteristics. The coefficient profiles were produced from log (lambda) sequences.The vertical lines are drawn on the value selected using five fold cross validation, where the best lambda resulted in non-zero coefficients for five features.
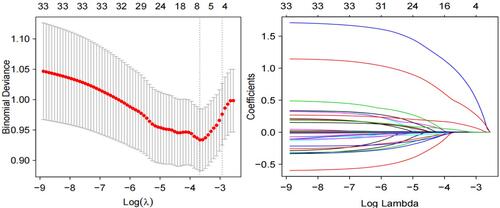
Figure 3 Nomogram to predict the probability of ISR in patients with stent implantation.
Notes: The nomogram included a medical history of COPD, GS score of vascular assessment before PCI, RC, monocyte, neutrophil/lymphocyte ratio.
Abbreviations: COPD, chronic obstructive pulmonary disease; GS scores, Gensini score; RC, remnant cholesterol.
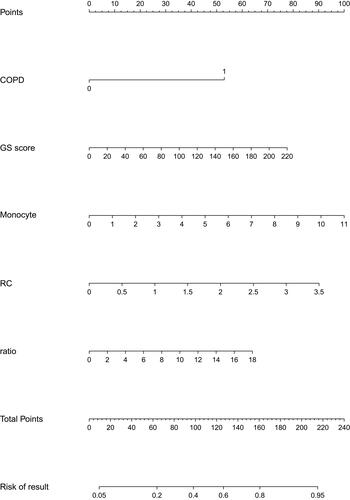
Table 2 Multivariable Logistic Regression Analysis of Predictors of ISR
Figure 4 ROC curves for validating the discrimination power of nomogram.
Abbreviation: ROC, receiver operator characteristic.
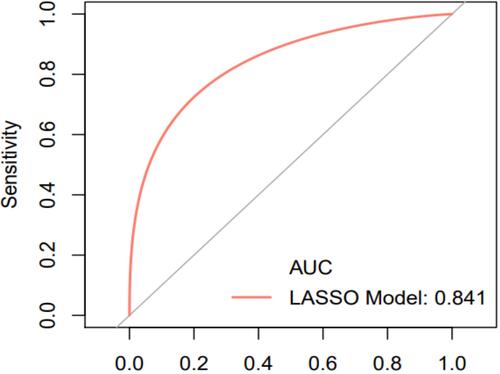
Figure 5 Calibration plots of the nomogram for the probability of PCI patients with ISR.
Notes: The x-axis represents prediction probability. The y-axis represents the actual probability. The diagonal dotted line represents a perfect prediction by an ideal model. The solid line represents the performance of the nomogram, of which a closer fit to the diagonal dotted line represents a better prediction.
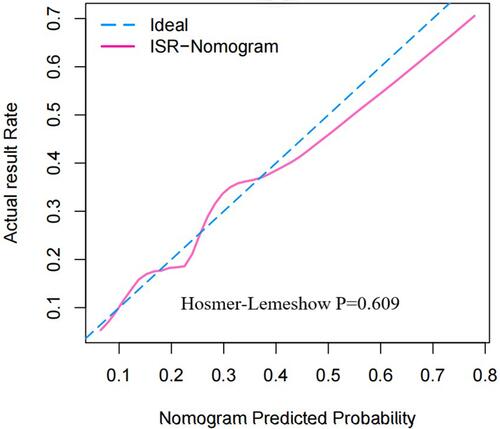
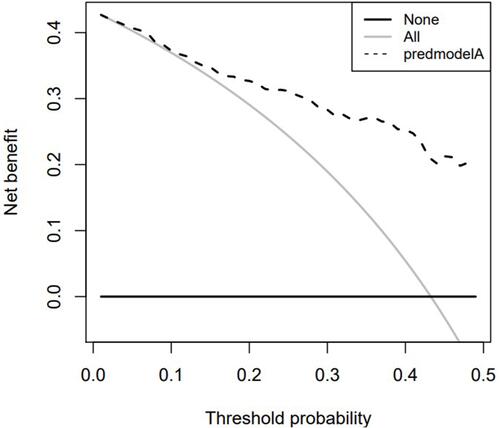
Figure 6 Decision curve analysis for the ISR prediction nomogram.
Notes: The ISR risk nomogram is represented by the dotted line. The thin solid line denotes the expectation that all patients are affected by ISR. The thick solid line denotes the assumption that there are no patients with ISR. When the threshold probability is >4.5, decision curve analysis demonstrates that adopting this ISR prediction nomogram has a net benefit.