Figures & data
Table 1 The Clinicopathological Characteristics of COAD Patients
Figure 1 Flowchart of data preparation, processing, analysis, and validation.
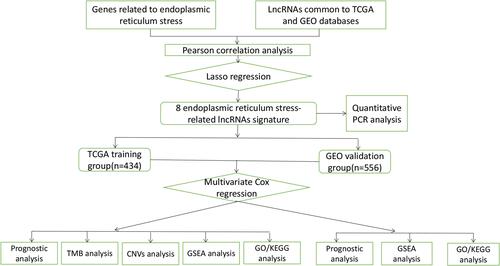
Figure 2 The construction of risk model and identification of ER stress-related lncRNAs. (A) The forest plot of univariate COX regression analysis among eight lncRNAs. (B) Partial likelihood deviation was plotted relative to the logarithm of lambda in 10-fold cross-validation. (C) The trajectory graph of each variable. (D and E) The expression heat map of eight lncRNAs and clinical features in TCGA (D) and GEO (E) cohorts. (F and G) The histogram of the expression of eight lncRNAs in the TCGA (F) and GEO (G) cohorts.
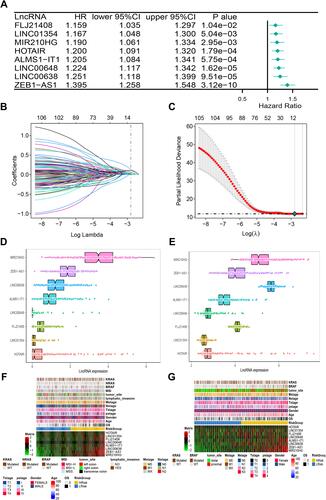
Table 2 Demographic and Molecular Comparison Between HRisk and LRisk in TCGA
Table 3 Demographic and Molecular Comparison Between HRisk and LRisk in GSE38582
Figure 3 The prognostic analysis of a single lncRNA in GEPIA. (A–G) The survival curves of 7 lncRNAs.
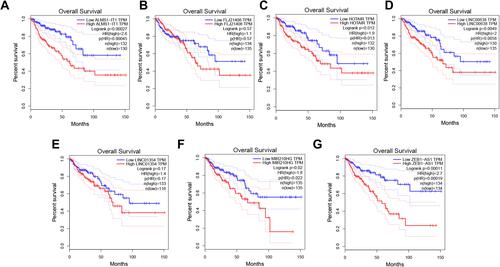
Figure 4 Analysis of prognostic survival of patients with COAD by risk model. (A and B) Kaplan-Meier curve and ROC curve drawn by dividing high- and low- risk groups based on the risk model in TCGA (A) and GEO (B) cohorts. (C and D) The risk score value of each sample, the survival status ranked from low to high-risk score in TCGA (C) and GEO (D) cohorts. (E) Nomogram to predict the 1-, 3-, 5-year OS for eight lncRNAs. (F) The calibration curves of the TCGA dataset. (G) The forest plot of multivariate COX regression analysis includes the risk model and clinical features.
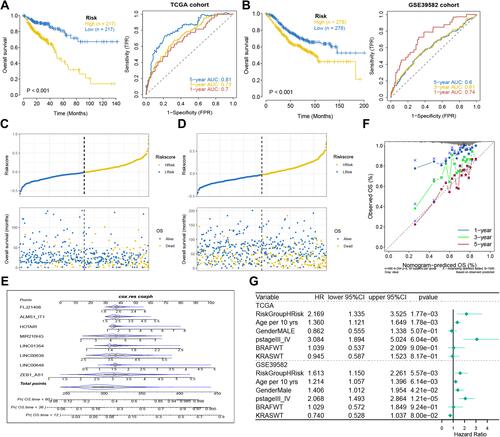
Figure 5 Analysis of prognostic survival of patients with COAD by risk model. (A and B) Kaplan-Meier curve based on the tumor location in TCGA (A) and GEO (B) cohort. (C–F) Kaplan-Meier curve based on BRAF and KRAS status in TCGA (C and D) and GEO (E and F) cohorts. NRAS status in TCGA (G). MSI status in TCGA (H). MSS status in TCGA (I).
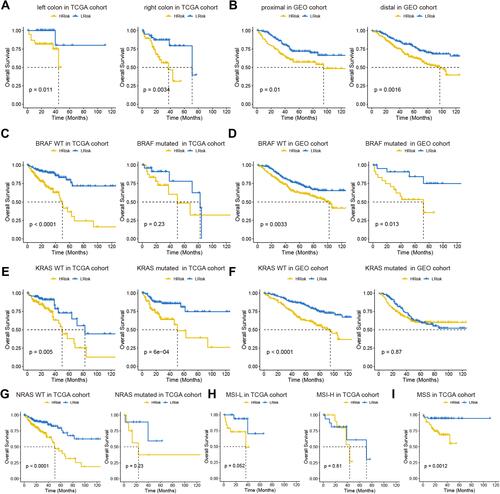
Figure 6 The summary information of somatic mutation in colon cancer samples from the TCGA database. (A and B) Somatic mutation in high- and low-risk groups, including frequency of different mutation classification, frequency of mutational variant types, frequency of SNV class, TMB level of each colon cancer sample, and top 10 mutated genes in colon cancer samples. SNP, single nucleotide polymorphism; INS, insertion; DEL, deletion; SNV, single nucleotide variants. (C and D) The waterfall plot of the mutation profile of a single gene in each COAD sample.
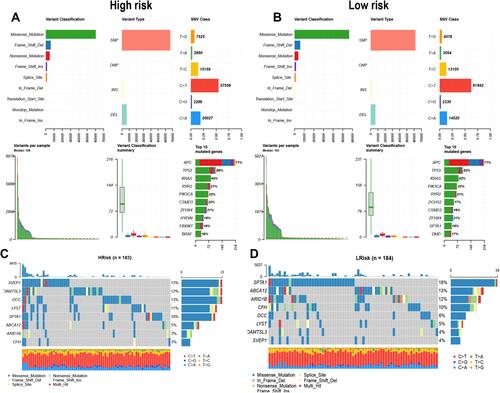
Figure 7 Continued.
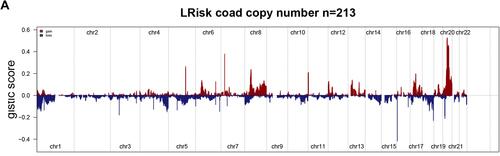
Figure 7 Gene copy number variations in COAD. (A and B) The amplification and deletion of gene fragments in COAD patients among two groups. (C) The comparison of copy number of the altered genome, lost genome, and gained genome between high- and low-risk groups.
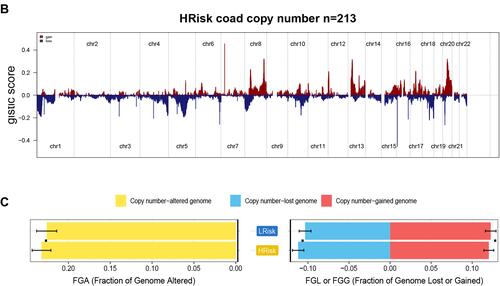
Figure 8 Continued.
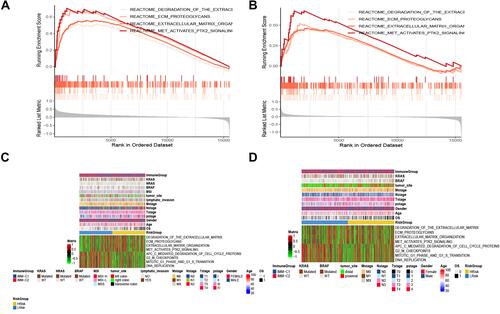
Figure 8 Enrichment analysis. (A and B) GSEA analysis reveals pathways in the regulation of high-expressed genes in the high-risk group. (C and D) The heat maps of the scores of enrichment pathways in each sample. (E–H) GO analysis and KEGG analysis.
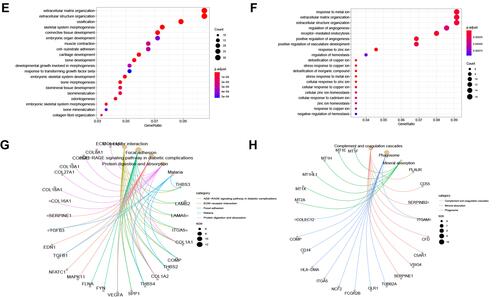
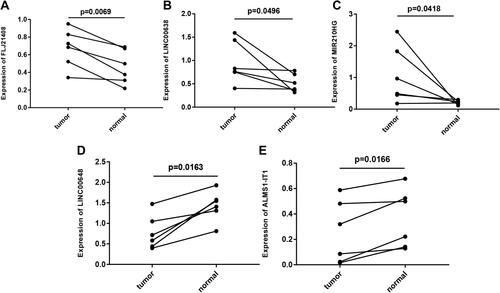
Figure 9 Gene expression profiles in clinical samples. (A) FLJ21408 expression profiles in clinical samples. (B) LINC00638 expression profiles in clinical samples. (C) MIR210HG expression profiles in clinical samples. (D) LINC00648 expression profiles in clinical samples. (E) ALMS1-IT1 expression profiles in clinical samples. In clinical samples, the target gene expression was normalized to GAPDH (ΔCt), data are presented as 2−ΔCt.