
Figures & data
Figure 1 Gating strategies. Gating strategies for detecting the percentage of monocytes expressing HLA-DR and the mode of HLA-DR expression on monocytes and the frequency of T lymphocytes, with illustration of an example of mHLADR in mild to moderate case and severe case.
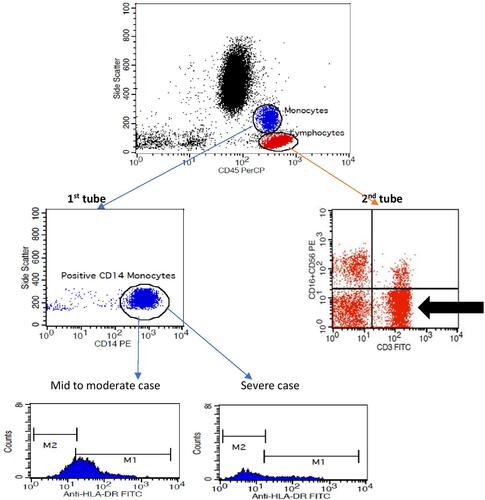
Table 1 Age, Demographic Data and the Clinical Disease Presentation of the Study Participants
Table 2 Comparison Between Mild to Moderate Group and Severe Group Regarding Laboratory Data
Table 3 Comparison of Study Variables Between Survivors and Non-Survivors
Table 4 Correlation of mHLA-DR MFI, Percentage of Monocytes Expressing HLA-DR and T Lymphocyte Percentage with the Other Studied Markers in All Study Cases (n=97)
Figure 2 Correlation of mHLA-DR MFI with other study markers in all study cases (n=97). (A) Positive correlation of mHLA-DR MFI with O2 saturation was seen (r=0.632, P < 0.001) (B) Negative correlation of mHLA-DR MFI with CRP was seen (r=−0.494, P < 0.001). (C) Positive correlation of mHLA-DR MFI with T lymphocyte % was seen (r=0.504, P < 0.001).
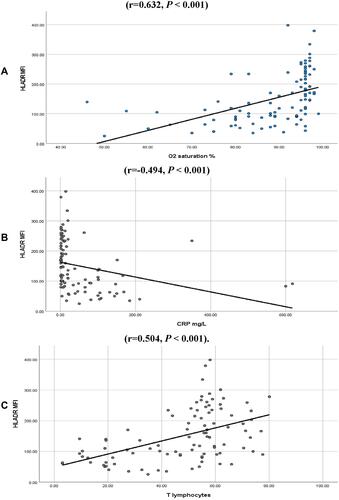
Table 5 (A) The ROC Curve Output Data for the Percentage of Monocytes Expressing HLA-DR, mHLA-DR MFI, T Lymphocytes Percentage, D-Dimer, and CRP as Discriminators of Severity Between Mild-to-Moderate and Severe Groups. (B) ROC Curve Output Data for T Lymphocyte Percentage Discrimination of Survival in Severe ICU Admitted Patients
Figure 3 Output data of ROC curves regarding monocyte % expressing HLA-DR, mHLA-DR MFI, T lymphocytes %. (A) Output data of ROC curve for monocyte % expressing HLA-DR, mHLA-DR MFI, T lymphocyte %, as discriminators of severity between mild to moderate group and severe group. (B) Output data of ROC curve to assess T lymphocyte frequency as a predictor of survival in ICU admitted patients (P< 0.001).
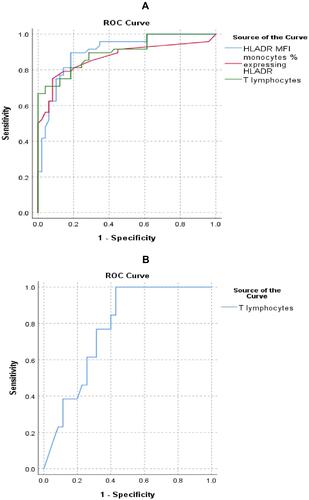
Table 6 Multiple Regression Analysis of Percentage of Monocytes Expressing HLADR, HLADR MFI, and T Lymphocyte Percentage with Co-Founders Affecting COVID-19 Severity and Survival