Figures & data
Figure 1 Family pedigree. Black symbols indicates affected individuals; open symbols indicates unaffected individuals; square indicates male; circle indicates female; arrow indicates proband.
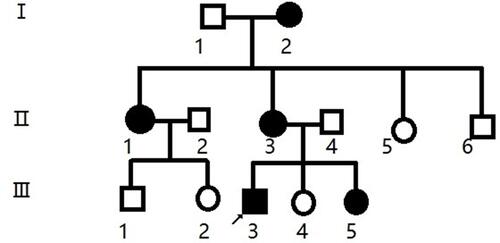
Table 1 Clinical Findings of Patients with TSC
Figure 2 Clinical manifestations of proband. (A) Facial angiofibroma. (B) Shagreen patch. (C) Hypopigmented macules. (D) Subependymal nodules.
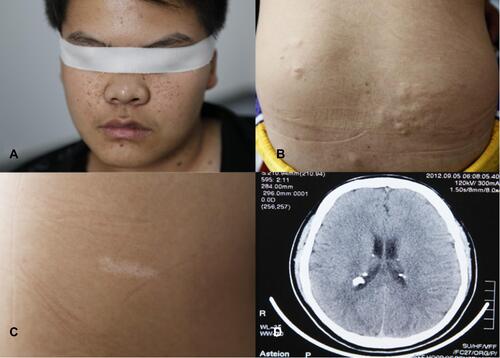
Table 2 Statistical Results of Sample Sequencing Data
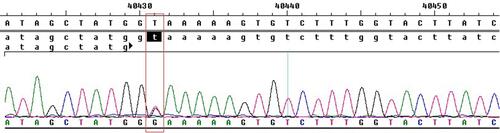
Figure 3 The splicing site mutation in the 9th intron region of TSC1 (c.913+2T>G).