Figures & data
Table 1 Baseline Characteristics and Clinical Data of the Enrolled Subjects
Table 2 Characteristics in the Training Set and the Validation Set
Figure 1 Characteristic variables selection using the least absolute shrinkage and selection operator (LASSO) logistic regression model. (A). LASSO coefficient profiles of 27 features. A coefficient profile plot was produced against the log (lambda) sequence. A vertical line was drawn at the value. (B) Tuning parameter (lambda) selection in the LASSO regression used 10-fold cross-validation. Binomial deviance was plotted versus log (lambda). The dotted vertical lines were drawn at the optimal values by using the 1-SE criteria.
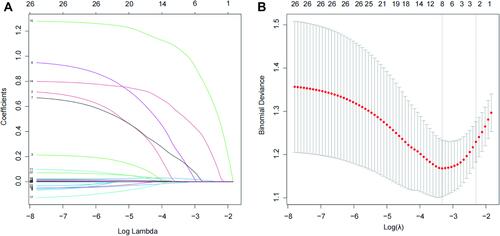
Table 3 Parameters Used to Establish the COPD with Intermediate or High PH Probability Prediction Model in the Training Set
Figure 2 Nomogram to predict the risk of COPD-PH. The nomogram integrates the predictors selected by the least absolute shrinkage and selection operator (LASSO), including GOLD stage, emphysema, RDW-SD, PaCO2, NT-pro-BNP, NLR.
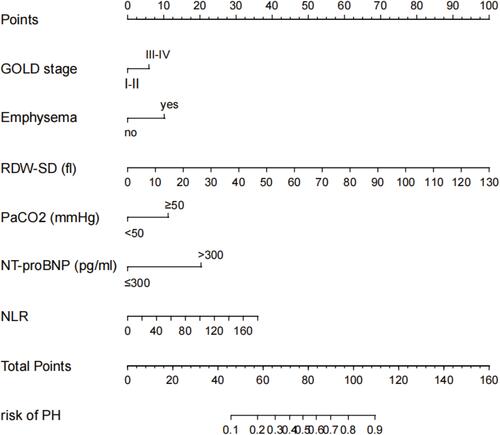
Figure 3 Receiver operating characteristic (ROC) curves of the training and validation sets. Blue AUC curve shows the discrimination of the model. Red AUC curve of the internal validation. The corresponding 95% confidence interval estimate is highlighted in black text.
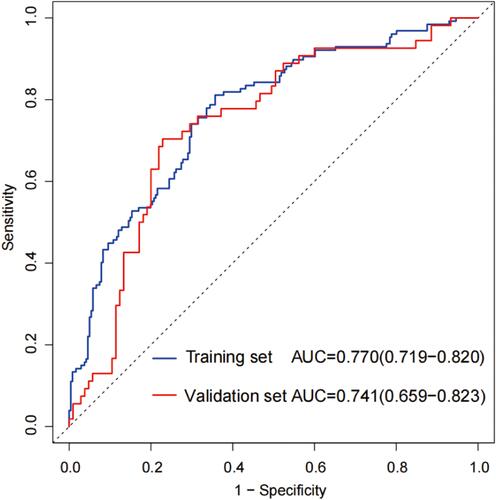
Figure 4 Calibration curve for the risk prediction model of COPD-PH. (A) Calibration curves in the training set. (B) Calibration curves in the validation set. The x-axis depicts predicted PH risk; the y-axis, diagnosed PH. A slope of 45° indicates the best calibration, while a prediction line above or below 45° indicates an underestimate or overestimate of the actual patient risk.
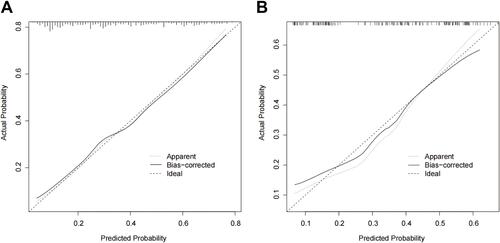
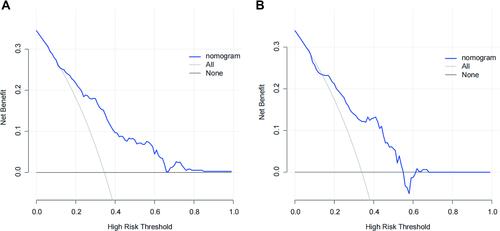
Figure 5 Decision curve analysis for the nomogram in the training cohort (A) and in the validation cohort (B). The blue solid line represents the nomogram.