Figures & data
Table 1 Descriptive statistics (mean ± standard deviation)
Figure 1 Correlations between thought–shape fusion (conceptual, interpretative, and total) and body image-related variables.
Abbreviations: BAS, Body Appreciation Scale; BIQLI, Body Image Quality of Life Inventory; BSQ, Body Shape Questionnaire; EDI-BD, Eating Disorder Inventory – Body Dissatisfaction; EDI-DT, Eating Disorder Inventory – Drive for Thinness; TSFC, thought–shape fusion-conceptual; TSFI, thought–shape fusion-interpretative; TSFT, thought–shape fusion-total.
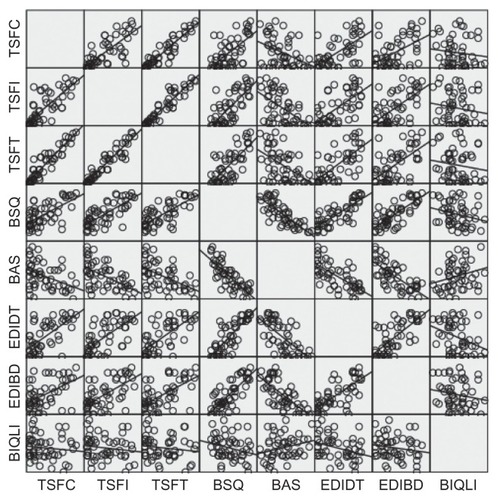
Table 2 Correlations (Spearman’s rho coefficient) between thought–shape fusion and body image-related variables
Table 3 High versus low Thought–Shape Fusion (TSF) total (mean ± standard deviation)