Figures & data
Figure 1 The expression of necroptosis-related gene in cervical cancer. (A and B) Expression profile revealed that 34 necroptosis-related genes were upregulated while 20 necroptosis-related genes were downregulated in cervical cancer. *p < 0.05; **p < 0.01; ***P < 0.001; - p > 0.05.
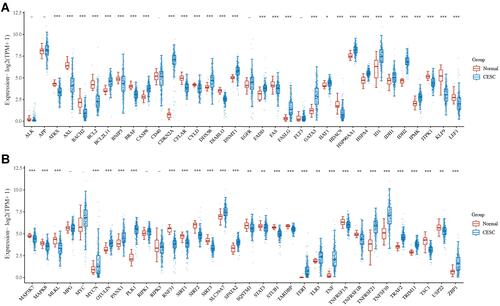
Figure 2 The mutation landscape and functional enrichment analysis of necroptosis-related gene in cervical cancer. (A and B) The mutation landscape of necroptosis-related genes in cervical cancer. (C and D) The enriched items in gene ontology and Kyoto Encyclopedia of Genes and Genomes analysis.
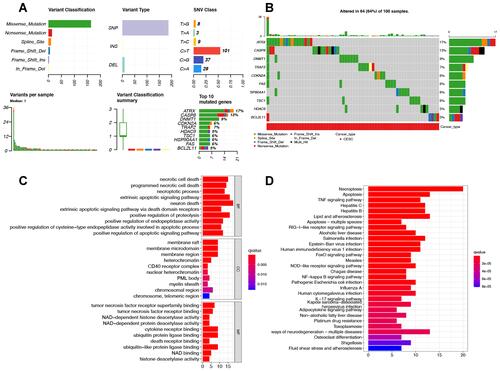
Figure 3 The prognostic significance of necroptosis-related gene in cervical cancer. Overall survival curve (A), progression free survival curve (B), disease specific survival curve (C) and disease-free survival curve (D) of cervical cancer patients with high/low expression of necroptosis-related gene.
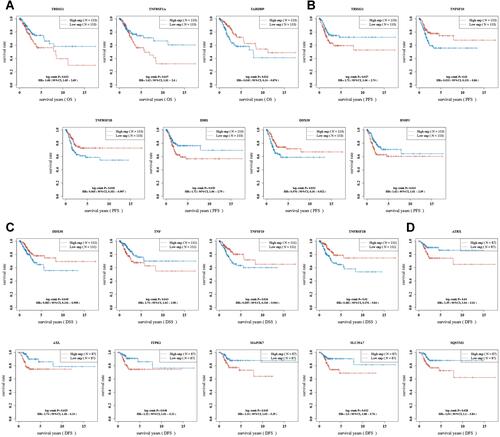
Figure 4 A necroptosis-related prognostic signature in cervical cancer. (A and B) The coefficient and partial likelihood deviance of prognostic signature. (C) The riskscore distribution, patient survival status and necroptosis-related gene expression profile of prognostic signature. Cervical cancer patients with high riskscore had a poor overall survival (D), with an AUC was 0.725, 0.763 and 0.637 in a 3-year, 5-year, and 10-year ROC curve (E).
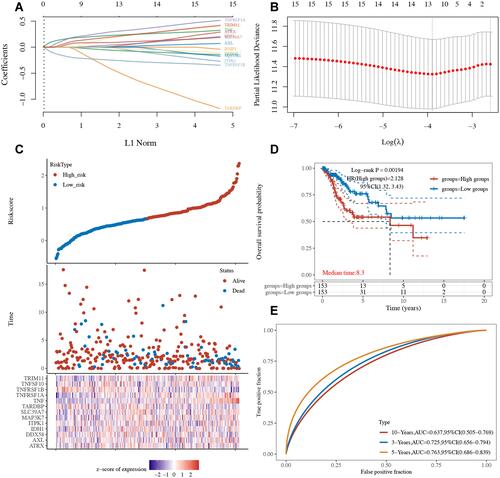
Figure 5 Riskscore was negatively correlated with immune infiltration in cervical cancer. The riskscore of patients was negatively correlated with the abundance of B cells (A), CD4+ T cells (B), CD8+ T cells (C), Neutrophils (D), Macrophage (E) and Dendritic cells (F) in cervical cancer.
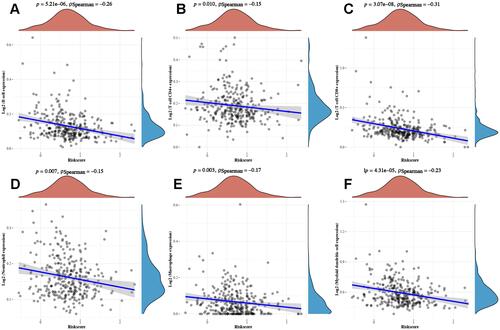
Figure 6 Consensus clustering of necroptosis-related prognostic signature. (A and B) Consensus clustering cumulative distribution function (CDF), relative change in area under CDF curve and tracking plot for k=2–6 (C) cervical cancer cases were divided into three clusters based on the consensus clustering matrix (k=3). (D) Heatmap of three clusters (cluster 1, 2, 3). (E) Kaplan–Meier curves of overall survival in three clusters of cervical cancer. (F and G) The difference of immune cell infiltration of three clusters in cervical cancer. **p < 0.01; ***P < 0.001.
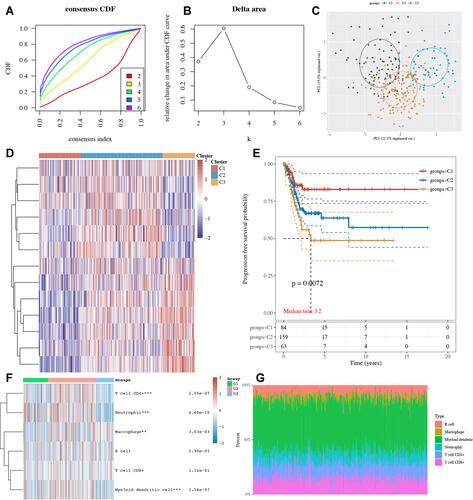
Figure 7 Hub gene identification and lncRNA–miRNA–mRNA regulatory axis in cervical cancer. (A) PPI network identified TNF as the hub gene. (B) The structure of TNF. (C) The miRNA targets predicted by miRDB, miRWalk and StarBase. (D and E) The expression and prognosis significance of miR-361-5p in cervical cancer. (F) The lncRNA targets predicted by lncBase and StarBase. (G) The expression of lncRNA COX10-AS1, TRIM52-AS1, and NUTM2B-AS1 in cervical cancer. (H) The prognosis significance of NUTM2B-AS1 in cervical cancer. **p < 0.01; ***P < 0.001, ****P < 0.0001.
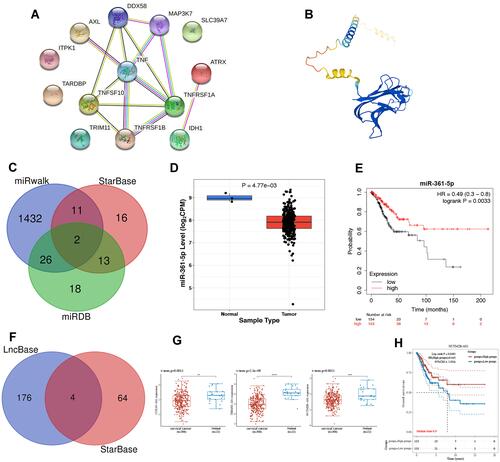
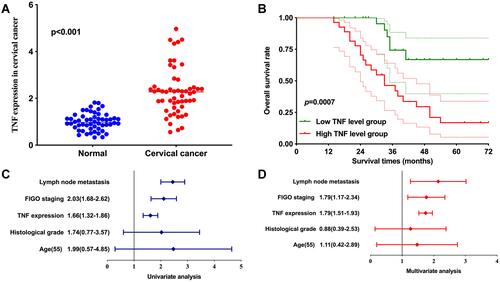
Figure 8 The expression and prognosis significance of TNF in cervical cancer. (A) TNF expression was upregulated in cervical cancer. (B) Cervical cancer patients with high TNF level had a poor overall survival. (C and D) Univariate and multivariate analysis demonstrated TNF expression and FIGO stage were prognosis factors of cervical cancer patients.