
Figures & data
Table 1 In Patient Characteristics of the Adult in-Patients (Number=7230) at Gadarif Hospital During 2017–2020 in Eastern Sudan
Table 2 Frequency (Proportions) of the Pattern of Admission of the Communicable and Non-Communicable Disease During 2017–2020 in Gadarif Hospital in Eastern Sudan
Figure 1 Frequency (proportions) of the pattern of admission of communicable and non-communicable diseases from 2017–2020 in Gadarif Hospital in Eastern Sudan.
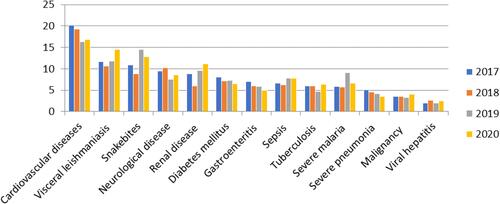
Table 3 Frequency (Proportions) of the Pattern of Mortality of the Communicable and Non-Communicable Disease During 2017–2020 in Gadarif Hospital Eastern Sudan
Table 4 The Case Fatality Rate of the Communicable and Non-Communicable Disease During 2017–2020 in Gadarif Hospital Eastern Sudan
Figure 2 Frequency (proportions) of the pattern of mortality of communicable and non-communicable diseases from 2017–2020 in Gadarif Hospital in Eastern Sudan.
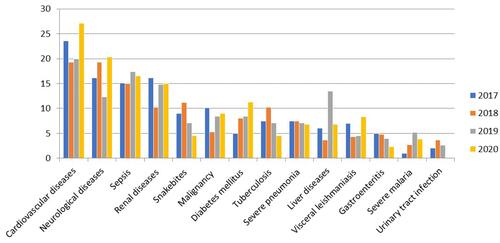
Figure 3 The case fatality rate of communicable and non-communicable diseases from 2017–2020 in Gadarif Hospital in Eastern Sudan.
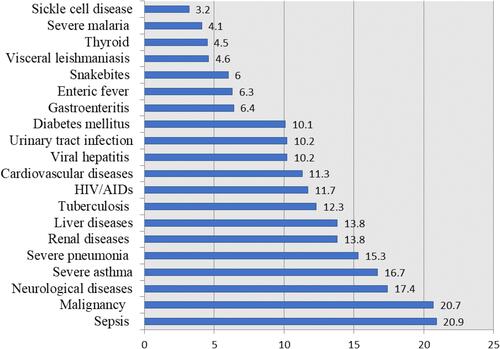
Table 5 Cox Regression (Adjusted and Non-Adjusted) Analysis for Factors Determining the In-Patient Mortality During 2017–2020 in Gadarif Hospital Eastern Sudan