
Figures & data
Table 1 Treatment Response and Patients’ Characteristics
Table 2 Patients’ Characteristics According to the Weight Status
Table 3 Association Between Clinical Characteristics and Treatment Response
Figure 1 Kaplan–Meier graph of survival functions by (A) sex, (B) age, (C) histopathology, (D) staging, (E) treatment response, (F) the presence of cachexia, (G) weight status, (H) weight D-dimer levels at baseline, (I) performance status.
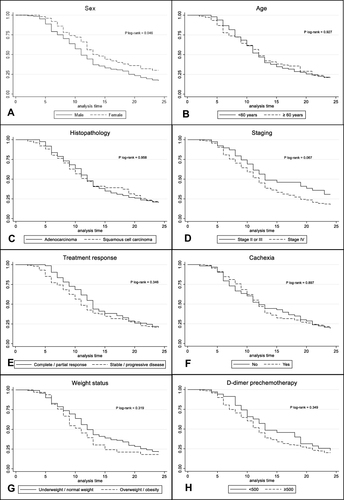
Table 4 Sex and Weight Status Were Associated with 2-Year Mortality Rate