
Figures & data
Figure 1 Flow chart of patient selection.
Abbreviations: CAD, coronary artery disease; SCD, Spontaneous coronary dissection; CA, coronary aneurysm; CSF, coronary slow flow.
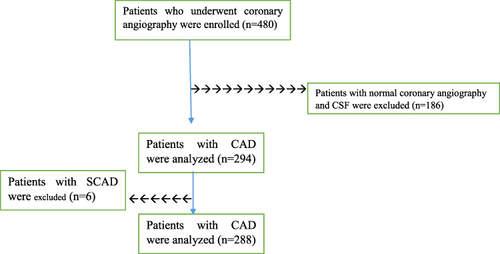
Table 1 Demonstrates the Sociodemographic Characteristics of the Patients
Table 2 Coronary Angiographic Features and Clinical Conditions of Different Patients
Table 3 Gensini Score According to Outcome in Terms of Management
Data Sharing Statement
The data is available from the corresponding author and can be accessed upon request.