Figures & data
Figure 1 Plasma total bilirubin and total bilirubin/albumin ratio levels in healthy controls (n=197) and patients with RA (n=197). (A) Plasma total bilirubin levels were significantly lower in the patients with RA than in the healthy controls. **p < 0.001. (B) Plasma total bilirubin/albumin ratio levels were significantly lower in the patients with RA than in the healthy controls. **p < 0.001.
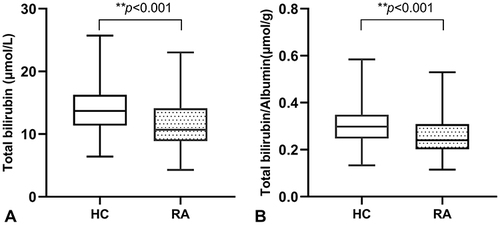
Table 1 Patient Characteristics and Results of Univariate Analysis
Table 2 Results of Multivariate Ordered Logistic Regression Analysis for Variables Affecting Disease Activity
Table 3 Correlations of Bilirubin and Total Bilirubin/Albumin Ratio with Inflammatory and Immunological Indexes
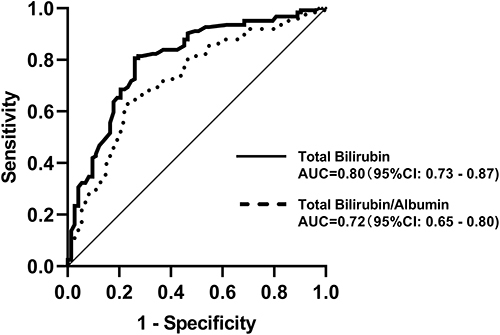
Figure 2 Accuracy of total bilirubin and total bilirubin/albumin ratio to predict disease activity in rheumatoid arthritis (DAS28-ESR<3.2 vs DAS28-ESR≥3.2).