Figures & data
Figure 1 Flowchart of study participant selection. *Key information refers to mortality, body mass index (BMI), acute physiology and chronic health evaluation (APACHE) score, hospital length of stay, intensive care unit (ICU) length of stay, and mechanical ventilation use.
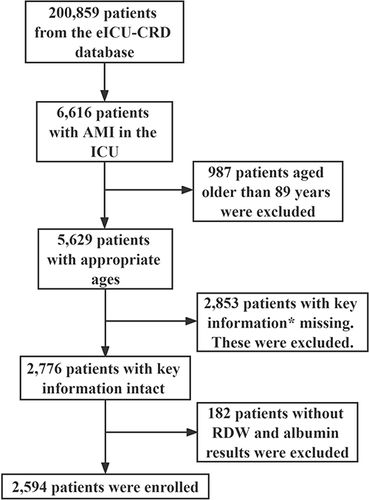
Table 1 Baseline Clinical Features of the Enrolled Participants, Survivors, and Non-Survivors
Table 2 Baseline Laboratory Features in Survivors and Non-Survivors
Figure 2 Receiver-operating characteristic curve of RAR, albumin, and RDW to predict in-hospital all-cause mortality of AMI.
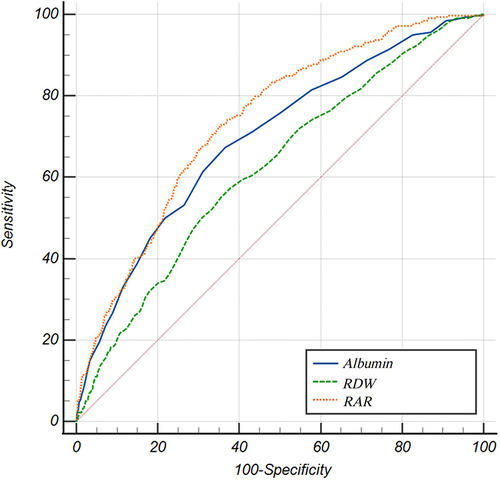
Figure 3 Receiver-operating characteristic curve of RAR and RAR combined with APACHE score to predict in-hospital all-cause mortality.
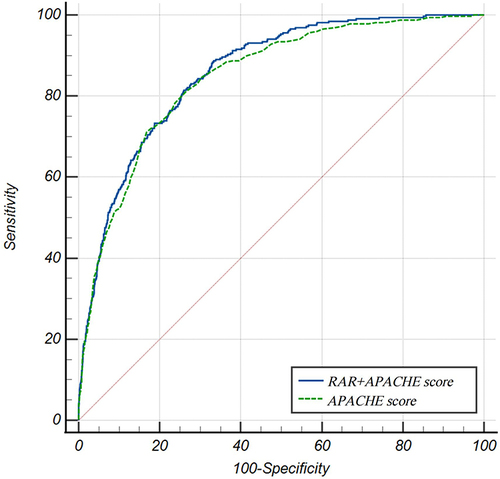
Table 3 Outcomes of the Patients with AMI Across Cutoff Points of the RAR
Table 4 Results of Multivariable Logistic Regression of RAR and In-Hospital All-Cause Mortality
Table 5 Subgroup Assessments of the Associations of In-Hospital All-Cause Mortality with RAR
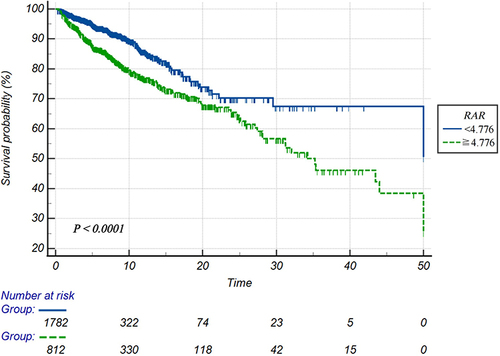
Figure 4 Kaplan–Meier curve of RAR for estimating in-hospital all-cause mortality of AMI.