
Figures & data
Figure 1 Number of new hospitalizations in MIA data and number of drugs used against COVID-19.
Notes: Blue bars show the numbers of newly COVID-19 hospitalizations in MIA data by their hospitalized week measured by the left scale. Yellow, orange, red, green, and pink lines, respectively, represent the number of inpatients who had been administered remdesivir, dexamethasone, tocilizumab, baricitinib and casirivimab/imdevimab or sotrovimab by their hospitalized week, as shown on the right scale. A single patient could have been administered several of the considered drugs.
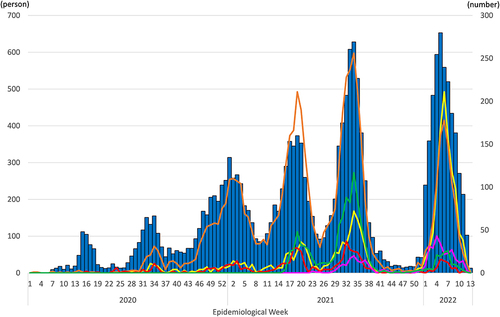
Figure 2 Number of underlying diseases of SARS-CoV-2 infected inpatients, by MIA data.
Notes: Blue, orange, gray, and yellow lines, respectively, represent the numbers of underlying diseases in which inpatients with cancer, hypertension, diabetes mellitus, and heart failure by their hospitalized week. One patient could have multiple considered underlying diseases.
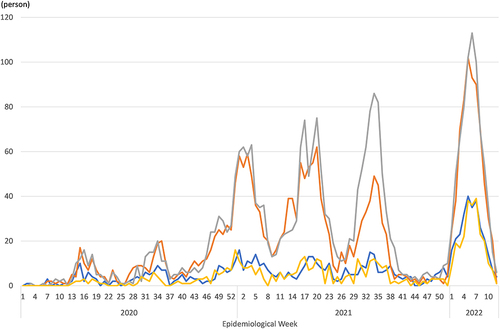
Table 1 Estimation Results of Logistic Regression for Death with the Administered Drug and Proportion of Mutated Strains
Table 2 Estimation Results of Logistic Regression for Death with Proportion of the Mutated Strains and with and without Administered Drugs
Table 3 Estimation Results of Logistic Regression for Death with Administered Drugs and Periods of Waves When the Mutated Strains Were Dominant