Figures & data
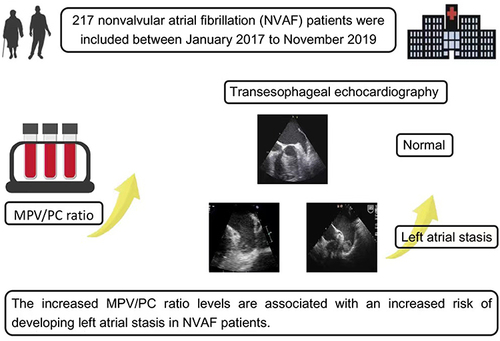
Figure 1 Flow chart of study participants.
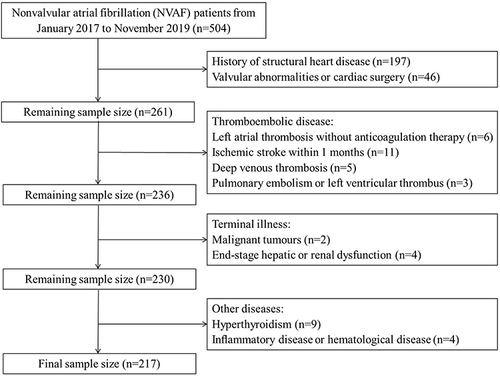
Table 1 Baseline Characteristics of Patients with or Without LAS (LAT and/or SEC)
Table 2 Univariate and Multivariate Regression Analysis for LAS (LAT and/or SEC)
Figure 2 Receiver operating characteristic curve for MPV/PC ratio and MPV or PC alone in predicting LAS in patients with NVAF. The MPV/PC ratio was a better predictor than either MPV or PC alone.
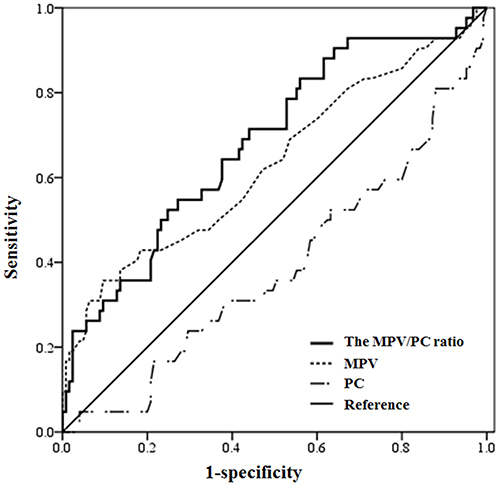
Table 3 Incidences of LAS in Different Potential Covariates
Figure 3 Proportion of the participants with LAS stratified by age, sex, types of AF, previous history of stroke/TIA, CHA2DS2-VASc score, LAD and LAVI. *P < 0.05.
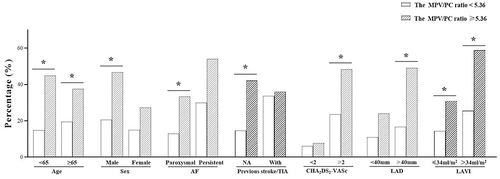
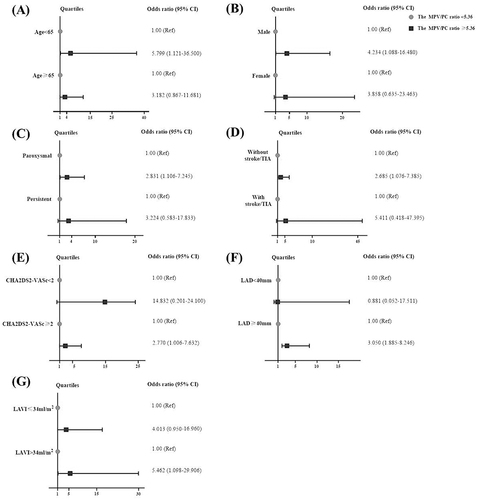
Figure 4 Effects of the MPV/PC ratio on LAS by prespecified subgroups. Prespecified subgroups of interest in this analysis are age (A), sex (B), types of AF (C), previous history of stroke/TIA (D), CHA2DS2-VASc score (E), LAD (F) and LAVI (G).