Figures & data
Figure 1 The mRNA expression levels of CD276 in normal tissues, cell lines and tumor tissues. (A) CD276 expression levels in normal tissues from GTEx database. (B) CD276 expression levels in tumor cell lines from CCLE database. (C) Comparison of CD276 expression levels between various human cancers from TCGA database and normal tissues from GTEx database. (D) Comparison of CD276 expression levels between different types of cancers and their normal controls from GEO database (*p < 0.05, **p < 0.01, ***p < 0.001, ****p < 0.0001, ns, no statistical difference).
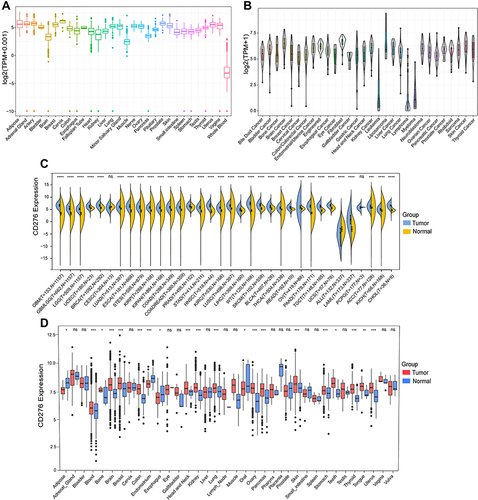
Figure 2 Identification of CD276 protein expression levels between different tumor tissues (right) and their normal controls (left) through immunohistochemistry images from the HPA database. We selected two visual fields of immunohistochemistry images for each tumor type. H-score was applied to evaluate the IHC staining. (A) Colon+Breast; (B) Liver+Lung; (C) Ovary+Cervix. (D) Statistical analysis of the H-score of CD276 in the tissues mentioned above (*p < 0.05, ***p < 0.001).
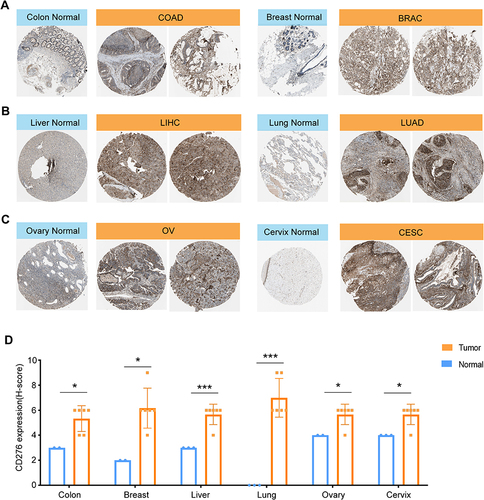
Figure 3 Validation of the mRNA and protein expression levels of CD276 in clinical samples of OV and CESC. (A) RT-qPCR analysis of the relative mRNA expression levels of CD276 in OV and the matched normal tissues (n = 10). (B) RT-qPCR analysis of the relative mRNA expression levels of CD276 in CESC and the paired normal tissues (n=5). (C) IHC analysis of the protein expression levels of CD276 in OV and the normal tissues (n = 6). (D) IHC analysis of the protein expression levels of CD276 in CESC and the normal tissues (n=8) (*p < 0.05, ****p < 0.0001).
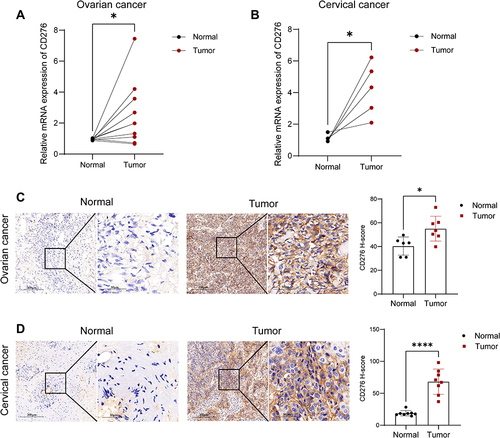
Figure 4 Correlation between CD276 expression levels and overall survival (OS) and disease-specific survival (DSS) in pan-cancer. (A) Forest plot displayed the univariate cox regression results of CD276 for OS from TCGA and TARGET database. (B) Kaplan-Meier OS curves of CD276 in indicated tumor types. (C) Forest plot displayed the univariate cox regression results of CD276 for DSS from TCGA and TARGET database. (D) Kaplan-Meier DSS curves of CD276 in indicated tumor types. Tumor types showed significant prognostic value (p < 0.05) in OS and DSS were marked with red fonts.
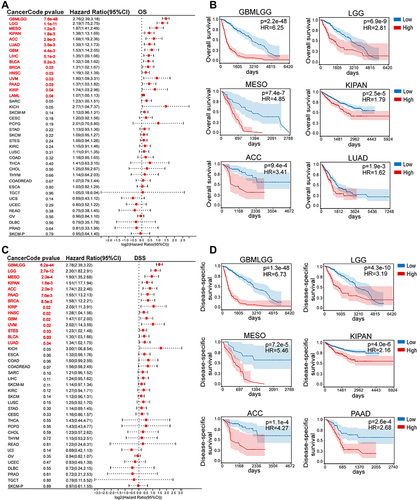
Figure 5 Association between CD276 expression levels and disease-free interval (DFI) and progression-free interval (PFI) in pan-cancer. (A) Pan-cancer forest plot of correlation of CD276 levels and DFI from TCGA and TARGET database. (B) Kaplan-Meier analysis of the correlation between CD276 expression levels and DFI in indicated tumor types. (C) Pan-cancer forest plot of correlation of CD276 expression and PFI from TCGA and TARGET database. (D) Kaplan-Meier analysis of the correlation between CD276 expression levels and PFI in indicated tumor types. Tumor types showed significant prognostic value (p < 0.05) in DFI and PFI were marked with red fonts.
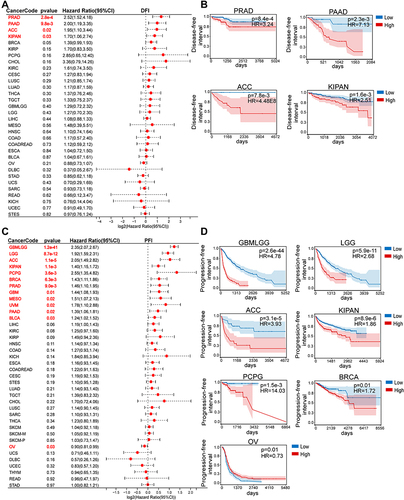
Figure 6 Correlation between CD276 expression levels and clinical features in tumors. (A) The correlation between CD276 expression levels and the size of primary tumors in GBM, GBMLGG and THYM. (B) The correlation between CD276 expression and different tumor stages in GBM, GBMLGG, KIPAN and THCA. (C) The correlation between CD276 expression levels and different molecular subtypes in tumors according to TISIDB database. Tumors were presented with a significant result.
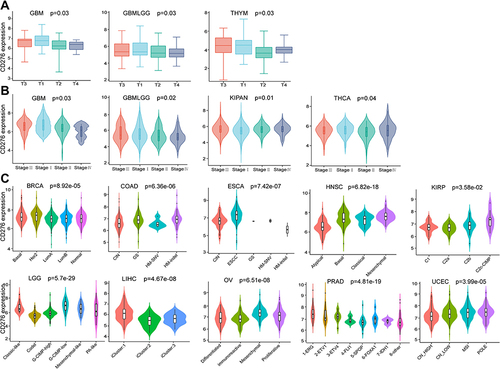
Figure 7 Association between CD276 expression and StromalScore, ImmuneScore and EsimateScore in GBMLGG, LGG, COAD, THYM and THCA.
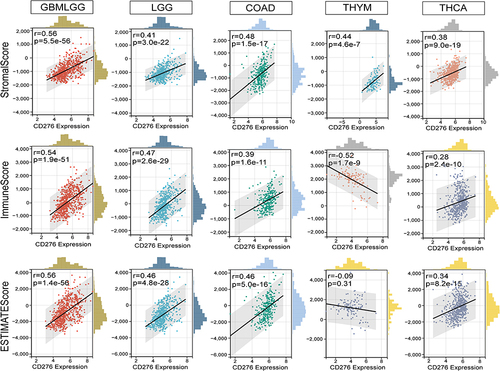
Figure 8 Correlation between CD276 expression and immune cell infiltration in human cancers. (A–E) Data from Timer database showed the association between CD276 and the infiltration of B cells, CD4+ T cells, CD8+ T cells, neutrophils, macrophages and dendritic cells (DCs) in GBMLGG, KIPAN, KIRC, LGG and LIHC. (F) The correlation between CD276 expression and the infiltration of different immune cell subtypes across 34 cancers based on CIBERSORT analysis (*p < 0.05).
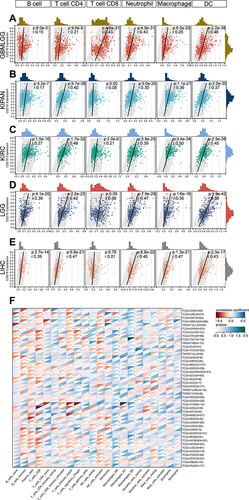
Figure 9 Correlation between CD276 expression levels and immune-related genes and immune subtypes in tumors. (A) The correlation of CD276 with 41 chemokines, 18 chemokine receptors, 21 MHC genes, 24 immunosuppressive genes, 45 immune-activating genes in pan-cancer. (B) The correlation between CD276 expression levels and immune subtypes in LGG, BRCA, LUAD, PAAD, STAD, KIRC, BLCA and LIHC based on TISIDB database. Six immune subtypes were as follows, C1, wound healing; C2, IFN-γ dominant; C3, inflammatory; C4, lymphocyte depletes; C5, immunologically quiet; C6, TGF-β dominant (*p < 0.05).
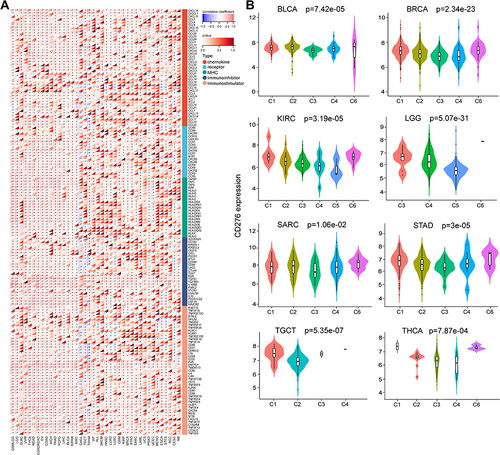
Figure 10 Relationship between CD276 and tumor immune microenvironment (TIME) at single-cell levels. (A) Different cell clusters in BRCA based on scTIME. (B and C) The main cell clusters that CD276 expressed in BRCA; (D) Different cell clusters in NSCLC based on scTIME. (E and F) The main cell clusters that CD276 expressed in NSCLC; (G) Different cell clusters in OV based on scTIME. (H and I) The main cell clusters that CD276 expressed in OV; (J–L) LR regulatory network between different cell types of CD276 in BRCA, NSCLC and OV. The nodes represent cell types and the edges represent interactions. The node size scales indicate the degree of nodes in the network, and the edge weight demonstrated the number of ligand-receptor pairs to support the interactions between two cell types.
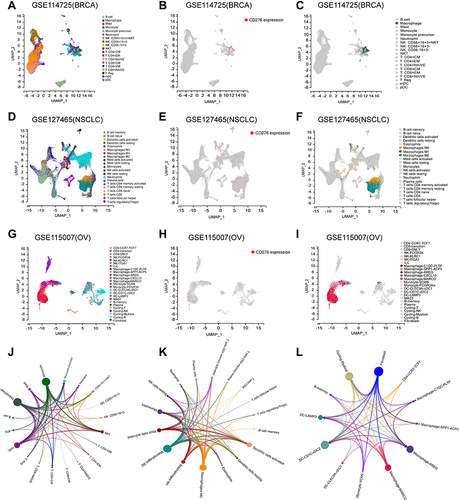
Figure 11 Association between CD276 expression levels and tumor mutation burden (TMB) (A), microsatellite instability (MSI) (B), mismatch repair (MMR) (C) and immune checkpoints (D) across cancers (*p < 0.05, **p < 0.01, ***p < 0.001).
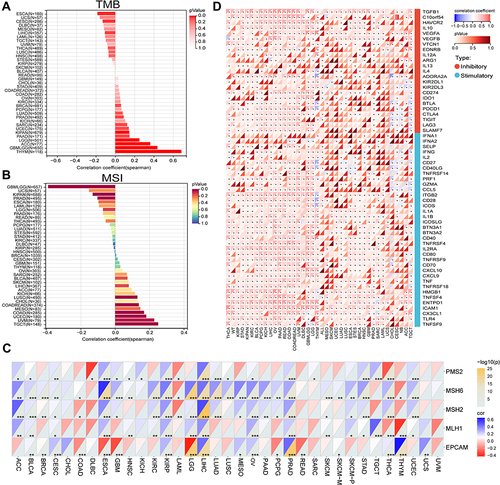
Figure 12 Biological functions and involved pathways of CD276 by GSEA. (A) The top 15 positive enriched immune-related terms; (B) The top 15 positive enriched KEGG terms; (C) The total positive enriched HALLMARK terms.
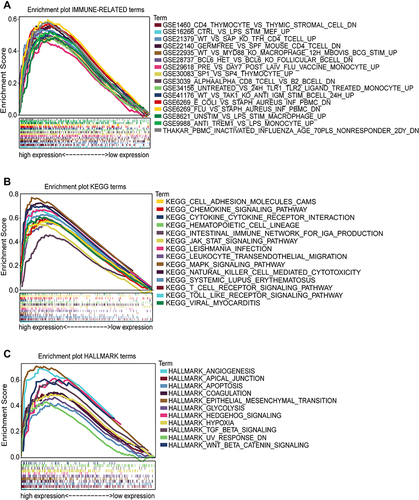
Figure 13 Drug sensitivity of CD276 based on CellMiner database. The top eight drug sensitivity of negative and positive correlation with CD276 expression levels. (A) 7-Hydroxystaurosporine (an inhibitor of calcium-dependent protein kinase (C); (B) AM-5992 (a potent and orally bioavailable dual inhibitor of CDK4 and FLT3); (C) Palbociclib (an orally active selective CDK4 and CDK6 inhibitor); (D) CFI-400945 (a potent and selective PLK4 inhibitor); (E) Chelerythrine (a selective PKC inhibitor); (F) Crizotinib (an oral tyrosine kinase inhibitor); (G) Gandotinib (a selective and ATP-competitive inhibitor of janus kinase 2 (JAK2) tyrosine kinase); (H) VX-689 (a specific inhibitor of Aurora A kinase); (I) INK-128 (a ATP-dependent mTOR1/2 inhibitor); (J) Irofulven (a DNA alkylating agent); (K) GSK-2126458 (an orally active and highly selective inhibitor of PI3K); (L) AZD-8055 (a selective and orally bioavailable ATP-competitive mTOR kinase inhibitor); (M) PF-4989216 (a selective inhibitor of PI3K); (N) Telatinib (an inhibitor of VEGFR2, VEGFR3, PDGFα, and c-Kit); (O) VS-5584 (a pan-PI3K/mTOR kinase inhibitor); (P) P-529 (an inhibitor of mTORC1 and mTORC2 complexes).
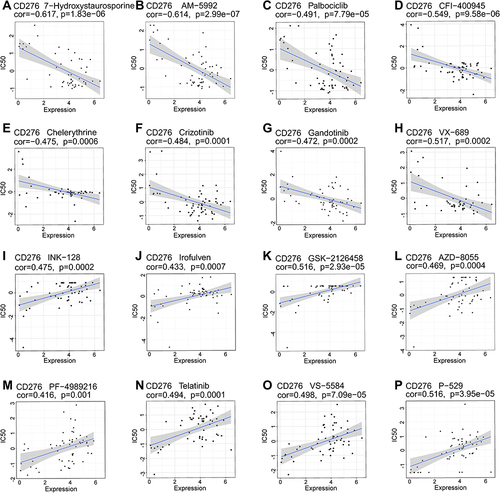
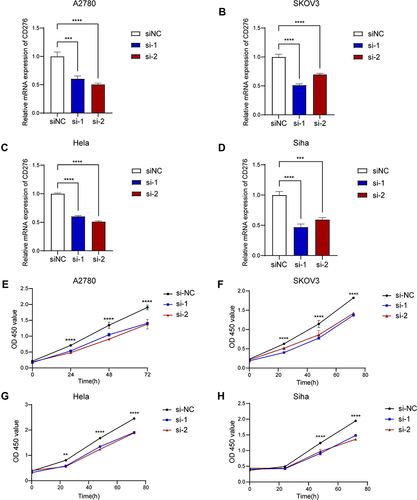
Figure 14 Exploration the biological role of CD276 in OV and CESC cells. (A–D) Knockdown efficiency of CD276 detected by qPCR in A2780, SKOV3, Hela and Siha cells. (E–H) The results of CCK-8 assay showing the decreased levels of CD276 inhibited the proliferation of A2780, SKOV3, Hela and Siha cell lines. Time, hours (**p < 0.01, ***p < 0.001, ****p < 0.0001).