Figures & data
Table 1 Comparison of Clinical Parameters in 67 BPH Patients Between EDH and SDH Groups (mean±SD)
Figure 1 The clinical parameters in BPH patients in the EDP and SDP groups. (A) Representative images of hyperplasia nodules in BPH patients. HE × 40. (B) The IPSS of BPH patients in the EDP and SDP groups. (C) The age of BPH patients in the EDP and SDP groups. (D) The prostate size of BPH patients in the EDP and SDP groups. (E) The QOL of BPH patients in the EDP and SDP groups. (F) The Qmax of BPH patients in the EDP and SDP groups. (G) The BOOI of BPH patients in the EDP and SDP groups. Values are the mean ± SD. Compared to EDH groups, **p < 0.01.
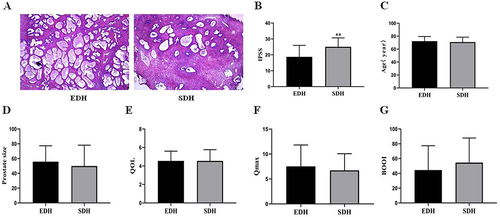
Figure 2 The collagen fibers percentage of prostatic hyperplasia nodules in the EDH and SDH groups and correlation analysis with clinical parameters of BPH patients. (A) Representative images showing collagen fibers (blue) and smooth muscle (red) of hyperplasia nodules in the EDH and SDH groups. HE × 100, Masson’s trichrome staining × 100. (B) Collagen fibers percentage of hyperplasia nodules in the EDH and SDH groups. (C) Collagen fibers percentage and smooth muscle of hyperplasia nodules. (D) Correlation analysis between collagen fibers percentage and IPSS. (E) Correlation analysis between collagen fibers percentage and age. (F) Correlation analysis between collagen fibers percentage and prostate size. (G) Correlation analysis between collagen fibers percentage and QOL. (H) Correlation analysis between collagen fibers percentage and Qmax. (I) Correlation analysis between collagen fibers percentage and BOOI. Values are the mean ± SD. Compared to EDH group, ** p < 0.01.
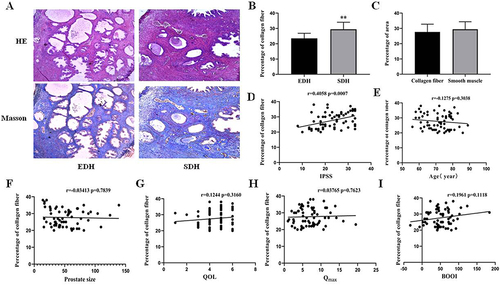
Table 2 The Up-Regulated and Down-Regulated DEGs in SDH Groups Compared to EDH Groups Were Screened by Integrated Microarray
Table 3 Top 10 Hub Genes in PPI Network Ranked
Figure 3 Volcano map of all DEGs between EDH and SDH groups. The red points represent up-regulated genes, the green points represent down-regulated genes, and the blue points represent no significant difference genes screened on the basis of |FC| > 2.0 and a corrected P-value of <0.05.
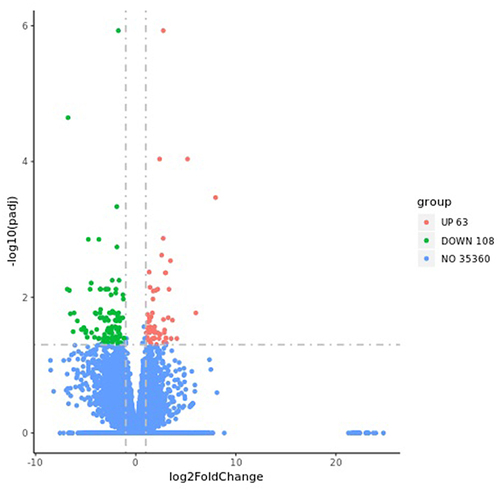
Figure 4 GO enrichment analysis of DEGs on the −log10 (P-value). BP for red bar, CC for green bar and MF for blue bar.
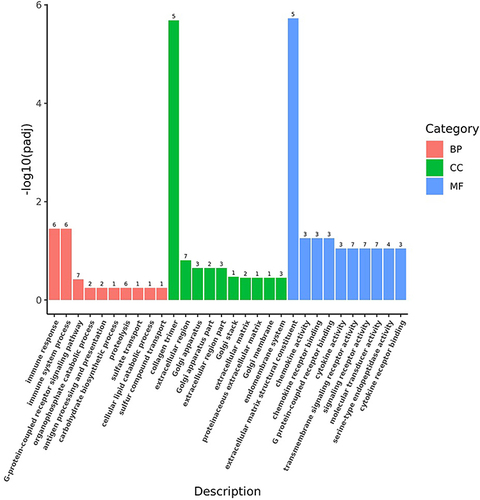
Figure 5 KEGG signal pathway enrichment analysis of DEGs on the −log10(P-value).
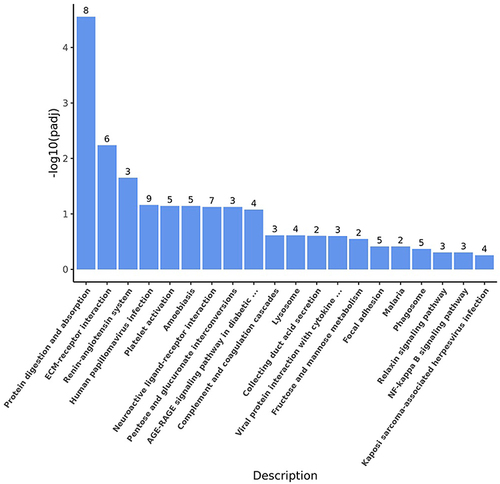
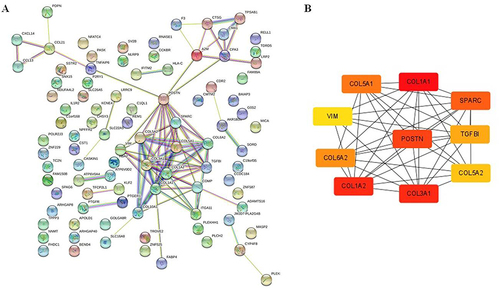
Figure 6 PPI network of identified DEGs constructed using Cytoscape software. (A) PPI network. Genes, the interaction of proteins between genes were represented with circles and lines. According to the degree of interaction, the size and color of the nodes were determined corresponding to each gene. (B) The interaction network of top 10 hub genes.