
Figures & data
Table 1 Comparison of Clinical Parameters Between Patients with and without Liver Fibrosis
Figure 1 Comparison of prevalence of hypertension, hyperlipidemia, and obesity between NLF group and LF group. (A) Comparison of prevalence of hypertension, between NLF group and LF group; (B) Comparison of prevalence of hyperlipidemia between NLF group and LF group; (C) Comparison of prevalence of obesity between NLF group and LF group. **P < 0.01.
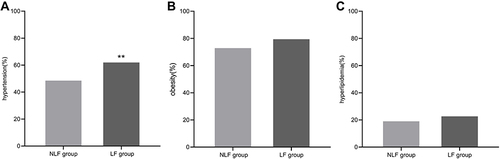
Table 2 Comparison of Clinical Parameters in Patients with Different Degrees of Liver Fibrosis
Table 3 Correlation Between FIB-4 and Other Indicators
Table 4 Logistic Regression Analysis of Liver Fibrosis in Type 2 Diabetes Mellitus Patients Combined with Non-Alcoholic Fatty Liver Disease