Figures & data
Figure 1 The CLEC4M expression was down-regulated in NSCLC. (a) The expression level of CLEC4M in normal tissue and NSCLC (LUAD and LUSC) in GSE30219. (b) The CLEC4M expression of LUAD and LUSC versus normal tissue in GEPIA2 database. (c) The expression of CLEC4M in matched LUAD adjacent tissue. (d) The expression of CLEC4M in matched LUSC adjacent tissue. (e) Representative images of immunohistochemistry detection of LUAD and LUSC patients (magnification 200x, 400x). (g) Histochemistry staining score of lung tumor and paired adjacent normal tissue derived from clinical lung tumor samples. (h and i) Correlation between CLEC4M expression and clinicopathological characteristics of NSCLC patients in TCGA and GSE30219.
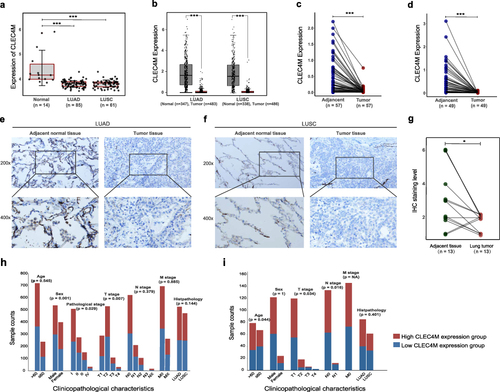
Figure 2 Diagnostic value of CLEC4M in NSCLC. (a and b) ROC curves of LUAD and LUSC patients in TCGA. (c and d) ROC curves of LUAD and LUSC patients in GSE30219. (e) ROC curves of all stage T1 patients in GSE30219. (f) CLEC4M expression between non-tumor and stage T1 NSCLC tumor tissue of GSE30219. *p value <0.05.
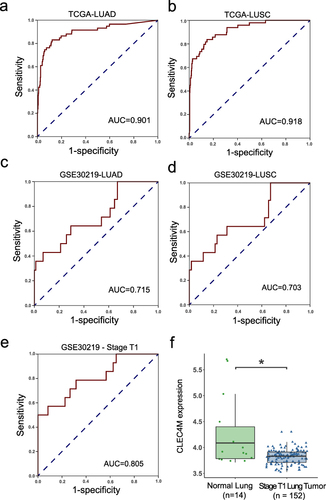
Figure 3 Prognostic value of CLEC4M in NSCLC. (a) OS curves of all NSCLC samples in GSE30219. (b and c) OS curves of LUAD and LUSC samples in GSE30219. (d and e) OS and PFS curves of NSCLC patients in CAarray database. (f and g) OS and PFS curves of NSCLC patients in GSE31210. (h) Nomogram plot of independent clinicopathological features in GSE30219.
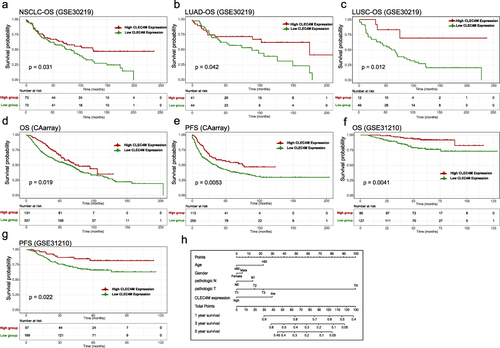
Table 1 The Impact of CLEC4M on NSCLC Prognosis with Clinicopathological Factors in the Kaplan-Meier Plotter Database
Table 2 Univariate and Multivariate Cox Regression Analyses of LUAD Patients in GSE30219 Regarding Overall Survival
Table 3 Univariate and Multivariate Cox Regression Analyses of LUSC Patients in GSE30219 Regarding Overall Survival
Figure 4 Association of CLEC4M expression with the infiltration level of immune cells in NSCLC. (a and b) TheCLEC4M expression of LUAD and LUSC in low immune score and high immune score groups. (c–p) The correlation of CLEC4M expression with tumor purity and immune infiltration level of LUAD and LUSC (TIMER). (q) The connection of CLEC4M copy number variations (CNVs) and immune infiltration levels in LUAD and LUSC. ***p value <0.001.
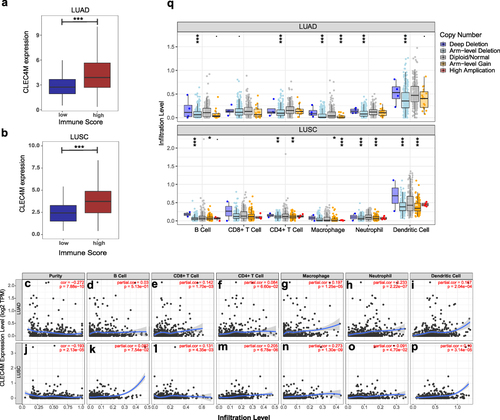
Table 4 The Correlations Between CLEC4M with Immune-Related Markers
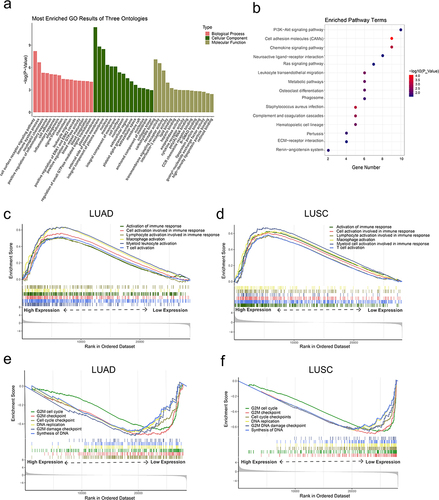
Figure 5 The functional enrichment analysis of CLEC4M in NSCLC. (a) Enriched GO terms of the CLEC4M-coexpressed genes. (b) Enriched KEGG pathway of the CLEC4M-coexpressed genes. (c and d) The enriched biological process of immune activation by GSEA according to CLEC4M expression of LUAD and LUSC patients. (e and f) The enriched cell proliferation-related functions using GSEA based on CLEC4M expression of LUAD and LUSC patients.