
Figures & data
Figure 1 Flowchart of the study.
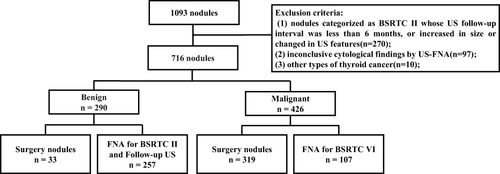
Figure 2 The ultrasound images of four thyroid nodules with or without HT. (A) Benign nodule without HT, solid, hyperechoic, wider than tall shape, smooth margin, no echogenic foci; (B) Benign nodule with HT, almost completely solid, isoechoic, wider than tall shape, smooth margin, no echogenic foci; (C) Malignant nodule without HT, solid, hypoechoic, taller than wide shape, smooth margin, macro-calcifications; (D) Malignant nodule with HT, solid, hypoechoic, taller than wide shape, irregular margin, no echogenic foci.
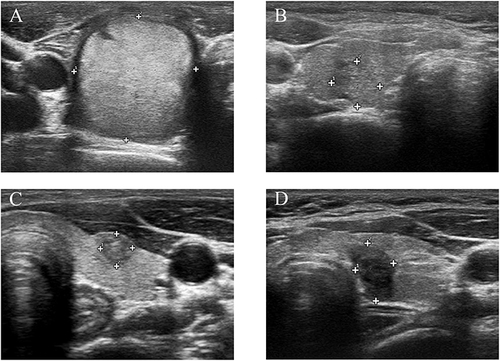
Table 1 Clinical Characteristics of the Study Population
Table 2 The Malignancy Rates of Various Categories of the ATA, ACR and KSThR Guidelines
Table 3 The Diagnostic Performance of the ATA, ACR and KSThR Guidelines in Detecting Malignant Thyroid Nodules
Table 4 Comparison of Unnecessary FNA Rates for the Diagnosis of Thyroid Cancer (≥1cm)