Figures & data
Figure 1 Flow chart of the design in the study.
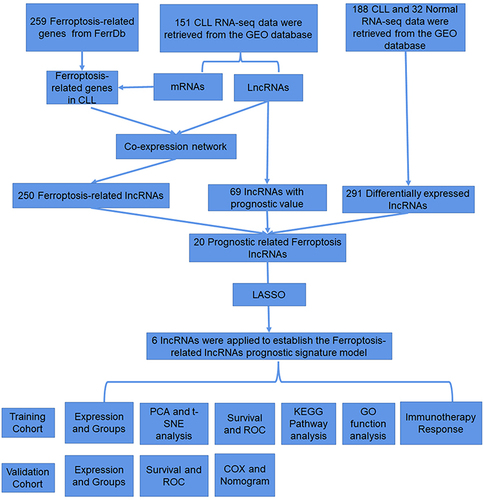
Figure 2 Construction of the Novel Ferroptosis-Related lncRNA Risk Score Prognostic Model for CLL patients (A)Venn diagram of the generation of 20 PFDELs. (B)Forest plots showed the HR and p value of the 20 PFDELs. (C) Correlation analysis of the 20 FRGs. (D and E) The LASSO coefficient profiles of the 6 FRLs signature. (F) Coefficients (λ) of the 6 FRLs in the FPS model. (G) Sankey diagram of the relationship between the lncRNAs, ferroptosis-related genes and the risk types.
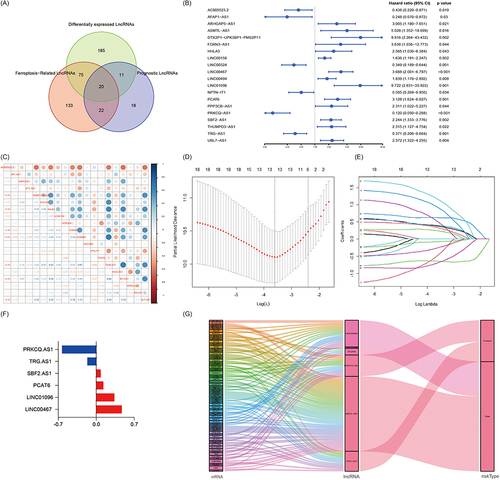
Figure 3 Evaluation of the Novel Ferroptosis-Related LncRNA Risk Score Prognostic Model in the GEO Dataset (A) The distribution and optimal cut-off value of risk scores in the training cohort. (B) The distributions of OS status, OS and risk score. (C) Heatmap of the expression levels of the 6 selected FRLs. (D and E) t-SNE and PCA plot of the CLL cohort visualizing the distribution of the low and high-risk groups. (F and G) Kaplan–Meier survival curves for OS and TFS of CLL patients stratified by FPS risk score. (H and I) Time-dependent ROC curves of the risk model for predicting the 1-, 3- and 5-year OS and TFS.
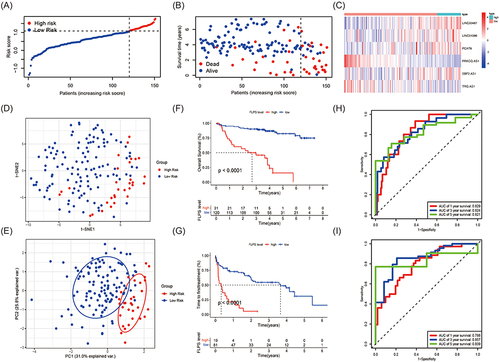
Figure 4 Functional Enrichment Analyses and Immune Cell Infiltration Between the High and Low-risk groups in CLL(A) The heatmap displaying the differentially expressed genes between the low-risk group and high-risk group. (B and C) The representative results of GO and KEGG analysis of DEGs between two groups. (D) Boxplots of the relative fraction of 22 immune cell types between two groups. (E and F) The score of immune cell types and immune-related functions using ssGSEA analysis, respectively.
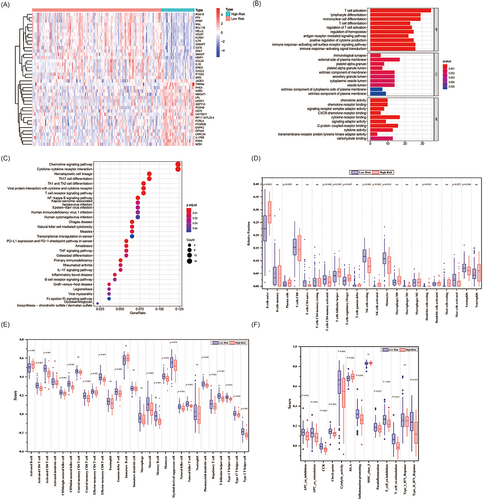
Figure 5 Validation of the Novel Ferroptosis-Related LncRNA Risk Score Prognostic Model (A) The distribution and the value of risk scores in the validation cohort. (B) The distributions of OS status, OS and risk score in the validation cohort. (C) Heatmap of the expression levels of the 6 FRLs in the validation cohort. (D-F) Kaplan–Meier survival curves for OS, PFS and TFS of CLL patients stratified by FPS risk score. (G-I) Time-dependent ROC curves of the risk model for predicting the 1-, 3- and 5-year OS, PFS and TFS.
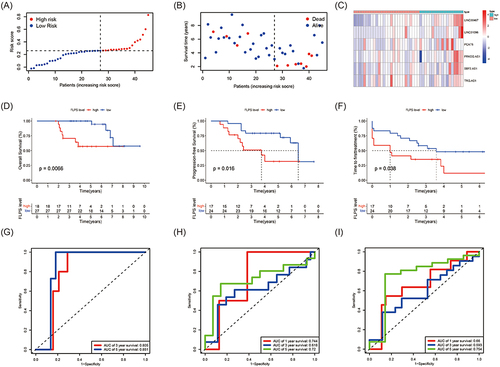
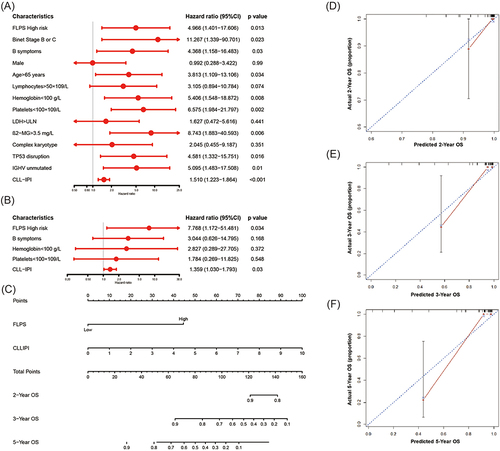
Figure 6 Independent Prognostic and Clinical Characteristics of the 6-FRLs Prognostic Model (A and B) The univariate and multivariate Cox regression model analyses for assessment of the prognostic value of clinical characteristics and FPS. (C) The nomogram model for predicting 2-, 3- and 5-year OS rate of CLL patients. (D-F) The calibration plot analysis to assess the nomogram accuracy for OS prediction at 2-, 3- and 5-year.