
Figures & data
Figure 1 Flow chart.
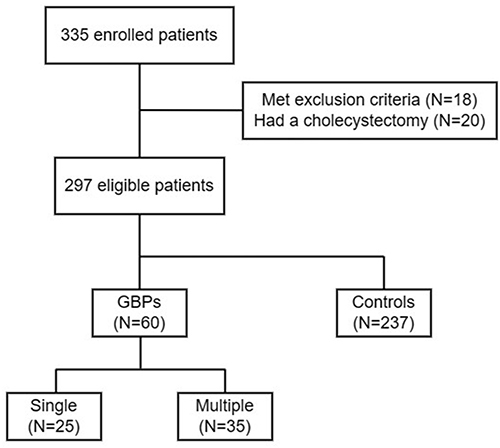
Table 1 Univariate Comparison Between the GBPs and Control Groups
Figure 2 The prevalence of SIBO: comparison between GBPs and control groups, single and multiple polyps groups.
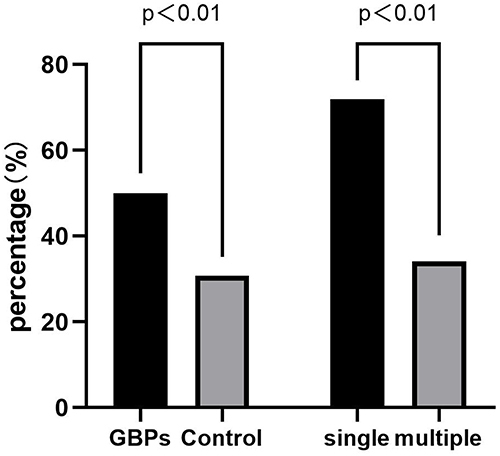
Table 2 Univariate Comparison Between the Single and Multiple Polyps Groups
Table 3 Multivariate Analysis of Risk Factors Associated with GBPs
Table 4 Multivariate Analysis of Risk Factors Associated with Single Polyps
Table 5 Subgroup Analysis for Association Between SIBO and GBPs Stratified by Sex, Age and BMI