Figures & data
Table 1 All respondents – age and BMI
Table 2 All respondents – frequency distribution of age
Table 3 Crosstabs – age groups by gender
Table 4 Categorization of respondents at high risk and low risk of OSAS
Table 5 Correlation between BMI and risk stratification for OSAS
Figure 1 Prevalence of high risk Berlin Questionnaire scores by age for males (blue) and females (red).
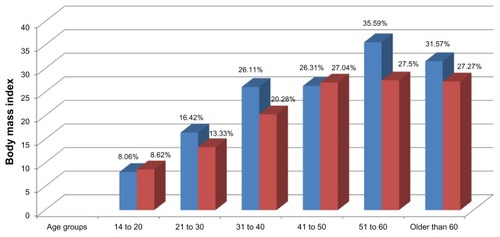
Table 6 All high risk respondents – BMI summaries as per age groups