
Figures & data
Table 1 Details of Studies and Datasets Used for MR Analysis
Table 2 Characteristics of the SNPs Associated with Mean Platelet Volume and Risk of Deep Vein Thrombosis
Table 3 Mendelian Randomization Estimates of the Associations Between Mean Platelet Volume and Risk of Deep Vein Thrombosis
Figure 1 Forest plot of single nucleotide polymorphisms (SNPs) associated with MPV and risk of DVT. Each black point represented the MR estimates for treatment of MPV on risk of DVT. Red points showing the overall causal effect including all SNPs using three different methods (IVW method, weighted median method and MR‐Egger method). The horizontal lines represent 95% confidence intervals of the MR estimates.
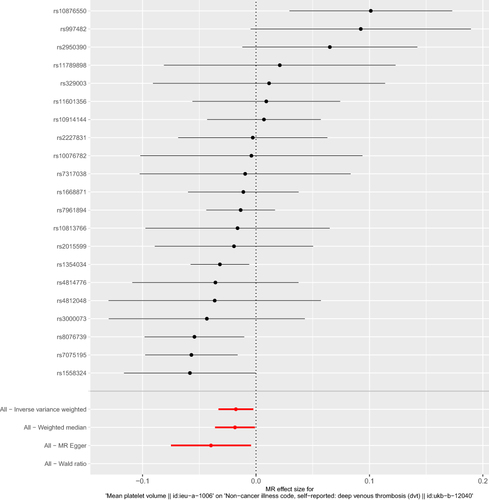
Figure 2 Scatter plot of SNPs associated with MPV and the risk of DVT. The plot relating the effect sizes of the SNP-MPV association (x-axis, SD) and the SNP-DVT associations (y-axis, log (OR)) with 95% confidence intervals. The regression slopes of the lines correspond to causal estimates using three MR methods including the IVW approach, Weighted median and MR‐Egger method.
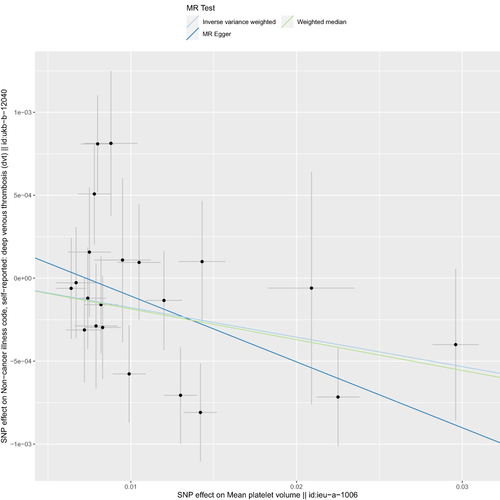
Figure 3 Leave-one-out (LOO) sensitivity analysis of SNPs associated with MPV and risk of DVT. Each black point represents the effect size(β) excluding one SNP estimated by the IVW method. The red point presented the MR estimate including all resting SNPs. The line represents 95% confidence interval of MR estimates. The leave-one-out analysis shows no single SNP was strongly or reversely driving the overall effect of MPV on the risk of DVT.
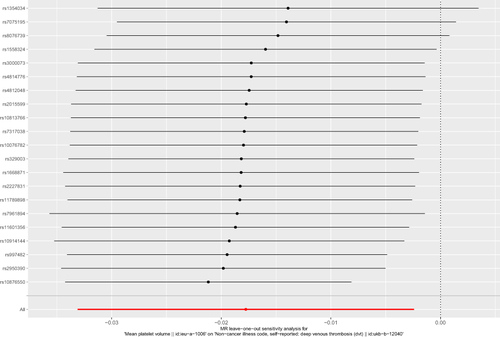
Table 4 Demographic Characteristics and Laboratory Data of the Included Patients with DVT and Without DVT