Figures & data
Table 1 Relationship Between MAGED4B Expression and Clinical Characteristics in Stomach Adenocarcinoma
Figure 1 MAGED4B mRNA has low expression in the STAD tissues and is negatively correlated with PFS. (A) PFS of STAD samples in the TCGA database; (B) Transcript expression level of MAGED4B in the STAD—para-carcinoma clinical samples; (C) Protein expression level of MAGED4B in 76 clinical specimens; (D) IHC results. **P<0.01, ***P<0.001.
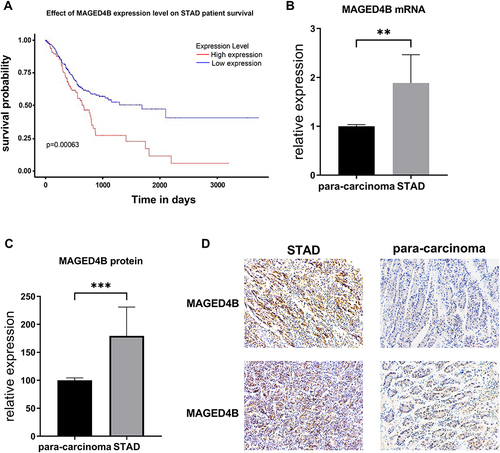
Figure 2 Expressions of MAGED4B in different STAD cell lines.
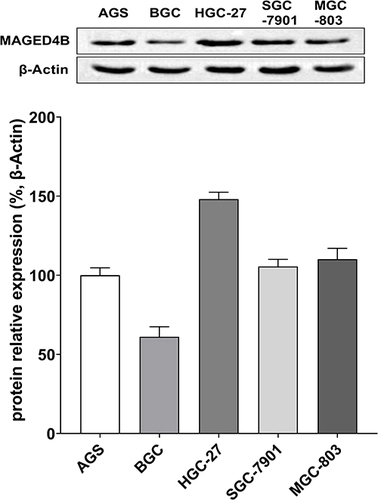
Figure 3 Construction of cell lines with overexpressed/silent MAGED4B. (A and B) qPCR was performed to detect the expression of MAGED4B in the cell lines with overexpressed/silent MAGED4B; (C and D) WB was performed to detect the protein expression of MAGED4B in the cell lines with overexpressed/silent MAGED4B; (E and F) Statistical results of MAGED4B protein expression the cell lines with overexpressed/silent MAGED4B. *P<0.05, **P<0.01, and ****P<0.0001.
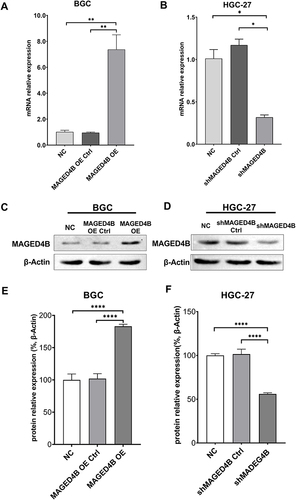
Figure 4 Overexpression of MAGED4B promotes cell migration, viability and proliferation. (A and B) Scratch test was performed to evaluate the migration ability of cell lines with overexpressed/silent MAGED4B; (C and D) CCK-8 to detect the cell viability of cell lines with overexpressed/silent MAGED4B; (E and F) EDU was performed to evaluate the cell proliferation ability of cell lines with overexpressed/silent MAGED4B. ****P<0.0001.
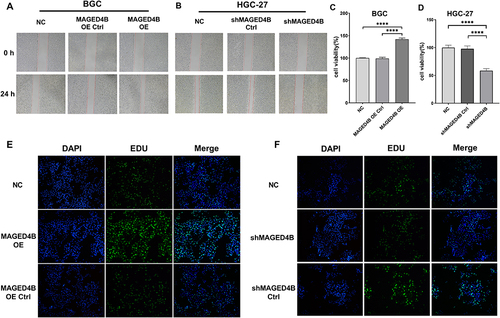
Figure 5 MAGED4B inhibits apoptosis of STAD cells and their sensitivity to cisplatin. (A) IC50 of cisplatin in the BGC and HGC-27 cells; (B) After treatment with 8 µ g/mL cisplatin for 24 h, the apoptosis of BGC and HGC-27 cells was detected by flow cytometry. (C) After treatment with 8 µ g/mL cisplatin for 24 h, the apoptosis of BGC and HGC-27 cells was detected by flow cytometry. ****P<0.0001.
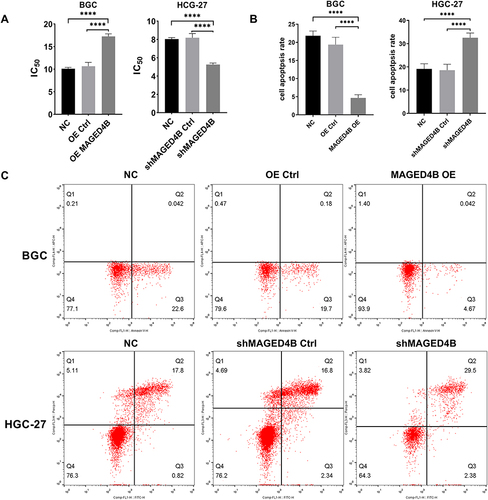
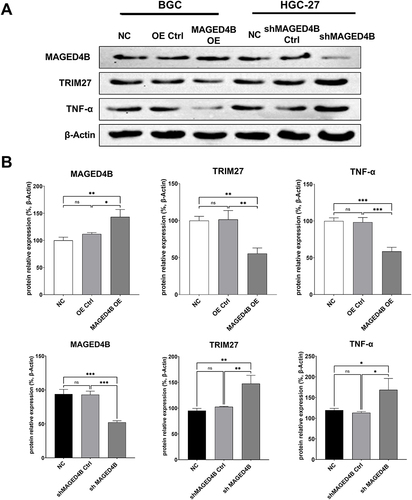
Figure 6 Expressions of related proteins in the cell lines with overexpressed and silent MAGED4B. (A) Expressions of related proteins detected by WB; (B) Statistics of protein expressions by WB. *P<0.05, **P<0.01 and ***P<0.001.