Figures & data
Figure 1 Flow chart of the analysis process in our study.
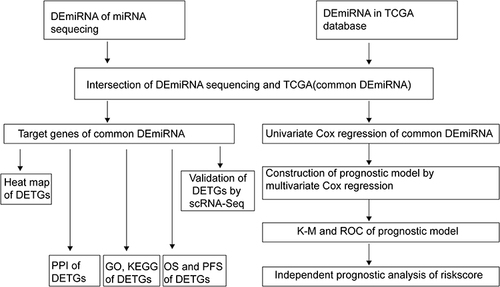
Figure 2 The top 20 differentially expressed miRNA between tumor and corresponding normal tissues in sequencing data.
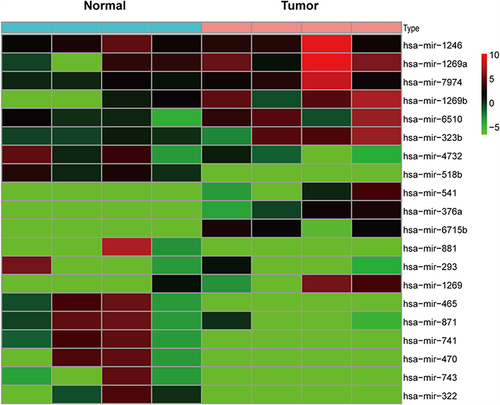
Figure 3 The top 20 differentially expressed miRNA in TCGA and common DEmiRNA. (A) The top 20 differentially expressed miRNA (DEmiRNA) in TCGA. (B) Venn diagram shown the Common DEmiRNA.
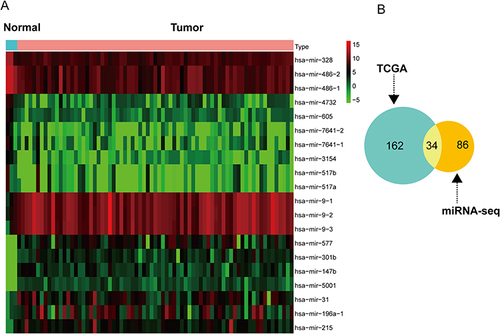
Figure 4 The heat map of the top 20 DETGs and 4 hub genes. The four hub genes (KPNA2, CEP55, TRIP13, MYBL2) were marked in red. CEP55 and MYBL2 are not only in the top 20 genes but also hub genes.
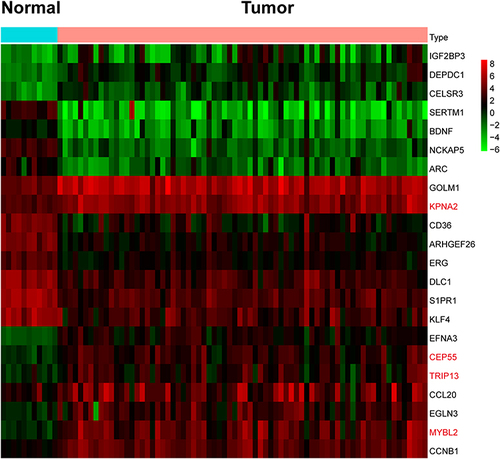
Figure 5 The protein–protein interaction network of DETGs. The small circle represents hub-genes. The red color represents up-regulated genes. The green color represents down-regulated genes.
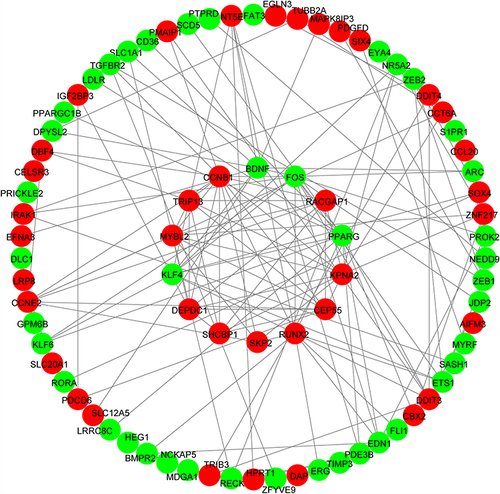
Figure 6 GO analysis on DETGs. The most enriched GO terms in the biological process (BP) category were “signal transduction”, “positive regulation of RNA polymerase II promoter”. The most enriched GO terms in the cellular component (CC) category were “cytoplasm”, “nucleus”. The most enriched GO terms in the molecular function (MF) category were “protein binding” and “transcription factor activity, sequence−specific DNA binding”.
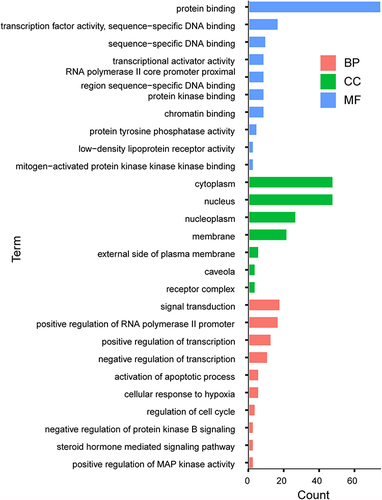
Figure 7 Prognosis-related DETGs. Univariate Cox proportional-hazards regression analyses were used to evaluate the progression-free survival (A) and overall survival (B) of differentially expressed target genes (DETGs).
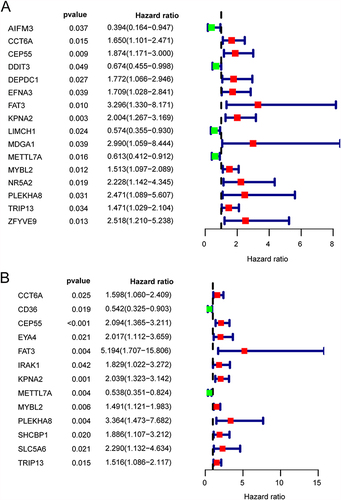
Figure 8 Prognosis-related DEmiRNA. Hsa-mir-200a, hsa-mir-21 were protective factors, and Hsa-mir-584 was risk factor.
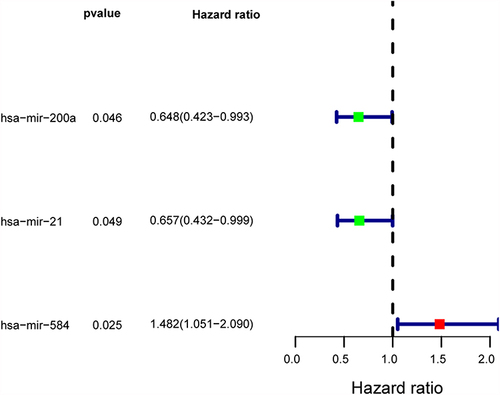
Figure 9 Validation of the expression level of prognosis-related DETGs. (A) UMAP plot of nine distinct cell lineages. (B) Dot plot showing the expression of representative genes in major cell types. (C) TSNE plot of tumor-epithelial cells and normal-epithelial cells in GSE 131907. (D) The expression level of prognosis-related DETGs in GSE 131907.
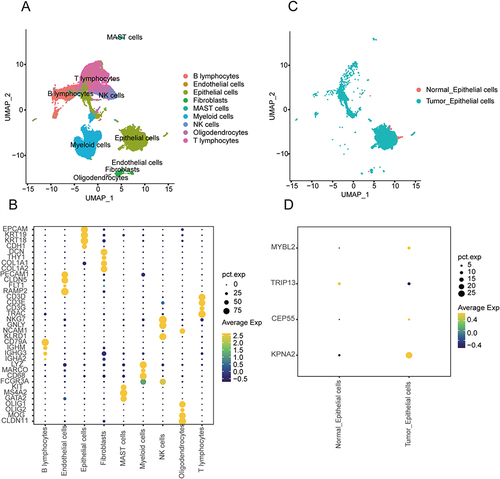
Figure 10 Prognostic risk model in non-smoking females with lung adenocarcinoma. (A) Kaplan–Meier survival curve display the overall survival of non-smoking females with lung adenocarcinoma according to the median cutoff value of risk score in all-dataset. (B) Time-dependent receiver operating characteristic curves (ROC) assess the prognosis of the prognostic model at 1, 3, and 5 years. (C) Kaplan–Meier survival curve display the overall survival of non-smoking females with lung adenocarcinoma according to the median cutoff value of risk score in train-dataset. (D) Kaplan–Meier survival curve display the overall survival of non-smoking females with lung adenocarcinoma according to the median cutoff value of risk score in test-dataset.
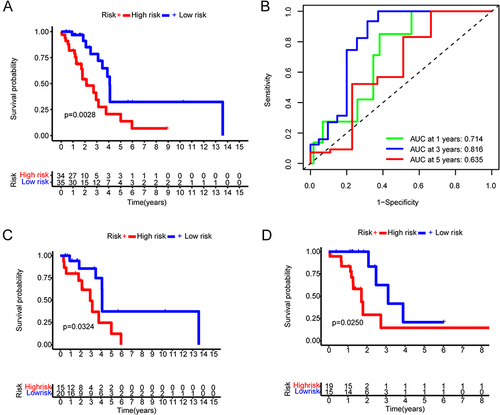
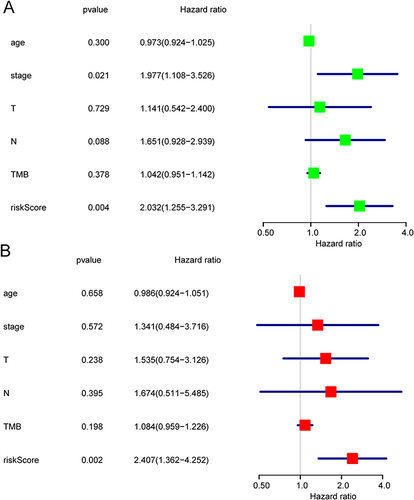
Figure 11 Independent prognostic of risk score. The univariate Cox regression (A) and multivariate Cox regression (B) analysis of the associations between the risk scores and clinical parameters and the overall survival (OS) of non-smoking females with lung adenocarcinoma.