
Figures & data
Table 1 Demographic Characteristics and Perioperative Data
Figure 1 Flow chart of the study inclusion process.
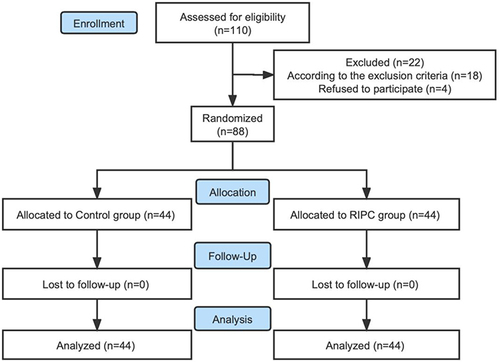
Table 2 Z Score in Each Neuropsychological Test
Figure 2 A histogram of the number of POCD and healthy people in both groups. *P<0.05, vs the Control group.
Abbreviation: POCD, Postoperative cognitive dysfunction.
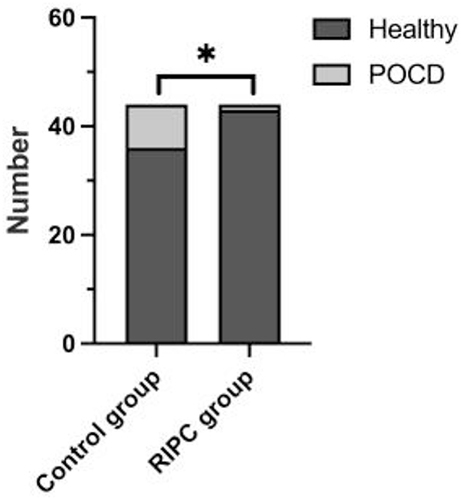
Table 3 Surgery-Related Data
Figure 3 Line chart of rSO2 changes at different time points. *P<0.001, vs the Control group. ##P<0.001, vs baseline in either group.
Abbreviation: rSO2, Regional cerebral oxygen saturation.
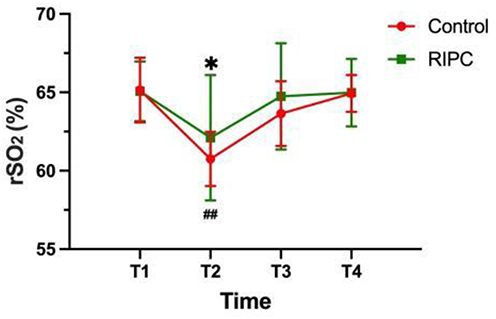
Figure 4 Changes in NSE and BDNF (mean ± SD) between the two groups. *P<0.001, vs the Control group. ##P<0.001, vs baseline in either group.
Abbreviations: NSE, Neuron-specific Enolase; BDNF, Brain-Derived Neurotrophic Factor.
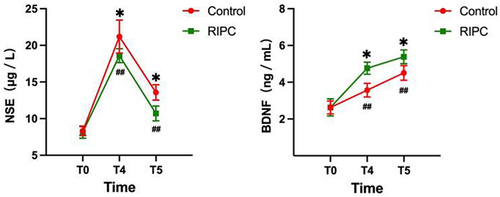
Table 4 Correlation Analysis of rSO2 and Neuropsychological Tests
Table 5 Correlation Analysis of MMSE and Serological Indexes