Figures & data
Figure 1 Percentage distribution of female and male finishers in Ironman Hawaii and in the Ironman qualifier races.
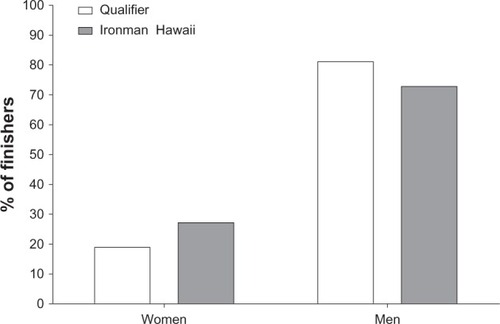
Figure 2 Percentage distributions of female (A) and male (B) finishers per nation in Ironman Hawaii and in the Ironman qualifier races.
Abbreviations: ARG, Argentina; AUS, Australia; AUT, Austria; BEL, Belgium; BRA, Brazil; CAN, Canada; DEN, Denmark; ESP, Spain; FRA, France; GBR, Great Britain; GER, Germany; IRL, Ireland; ITA, Italy; JPN, Japan; MEX, Mexico; NED, The Netherlands; NZL, new Zealand; RSA, Republic of South Africa; SUI, Switzerland.
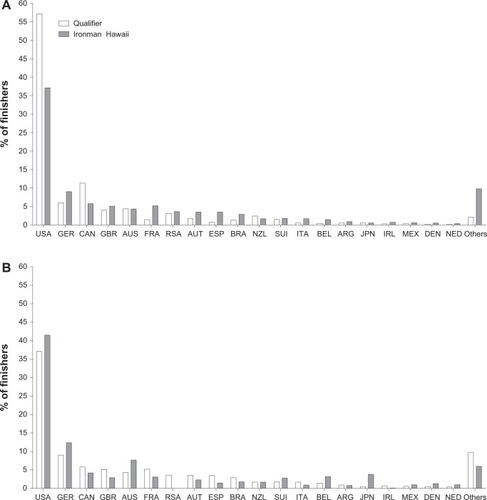
Table 1 Percentage distribution of women and men finishers per nation in the Ironman qualifier races and Ironman Hawaii
Figure 3 Percentage distribution of female (A) and male (B) finishers per age group in Ironman Hawaii and in the Ironman qualifier races.
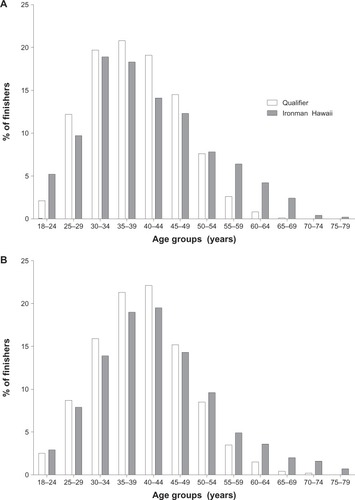
Table 2 Percentage distribution of men and women finishers per age group in the Ironman qualifier races and in Ironman Hawaii
Figure 4 Performance for the top ten women per age group in overall race time in the Ironman qualifier races and in Ironman Hawaii.
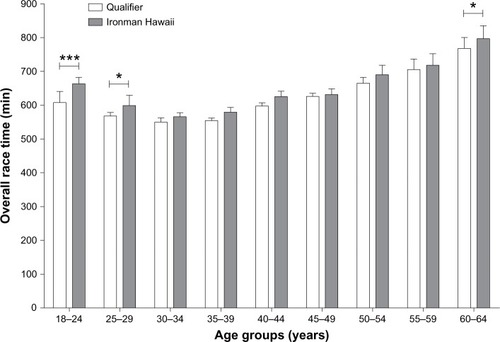
Figure 5 Performance for the top ten women per age group in the swim split (A), the bike split (B), and the run split (C) in the Ironman qualifier races and in Ironman Hawaii.
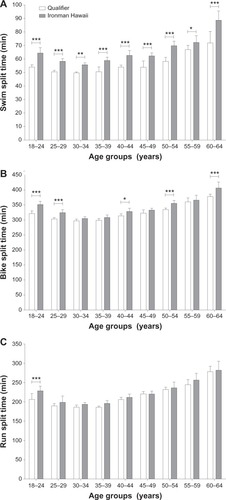
Figure 6 Performance for the top ten men per age group in overall race time in the Ironman qualifier races and in Ironman Hawaii.
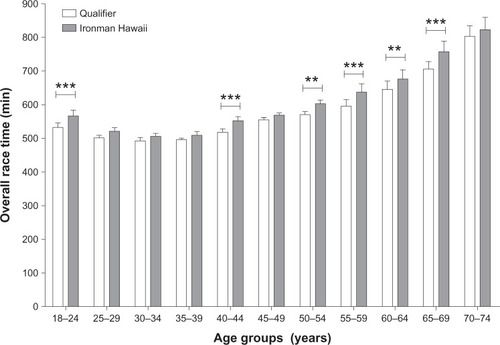
Figure 7 Performance for the top ten men per age group in the swim split (A), the bike split (B), and the run split (C) in the Ironman qualifier races and in Ironman Hawaii.
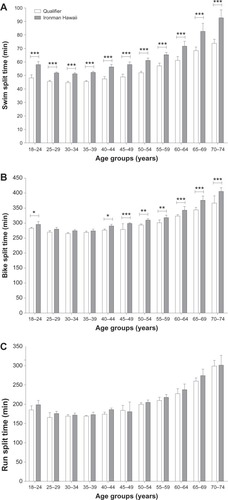
Table 3 Ironman qualifiers and qualifying slots for Ironman Hawaii in 2012