Figures & data
Figure 1 Study selection flow diagram.
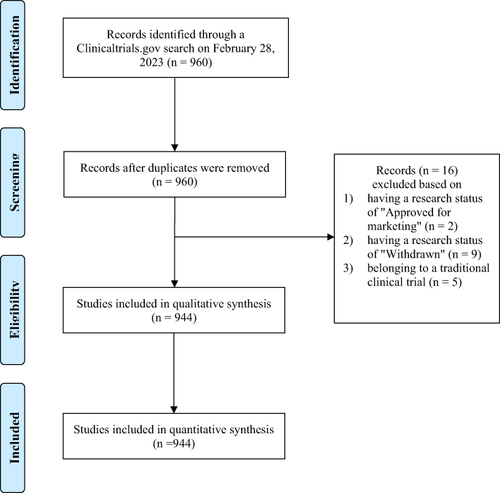
Table 1 General Characteristics of Real-World Registration Studies
Figure 2 Number of registered studies by condition. Only the top 20 conditions are shown.
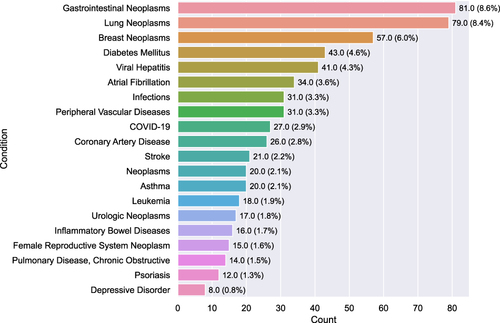
Figure 3 Number of registered studies in China and the United States by condition. Only the top 10 conditions are shown.
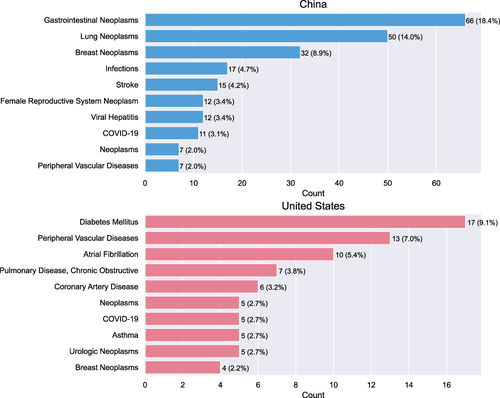
Figure 4 Number of real-world registration studies in each area.
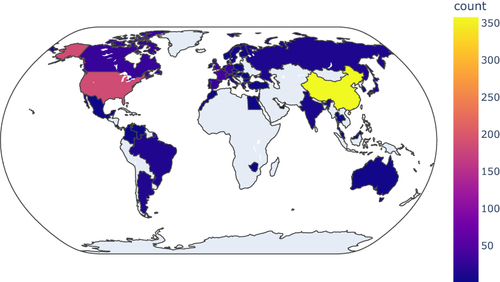
Figure 5 Number of registered studies in the top 20 countries.
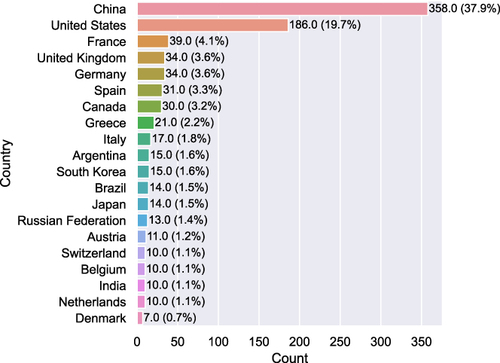
Figure 6 Number of new studies registered at ClinialTrials.gov each year and by country.
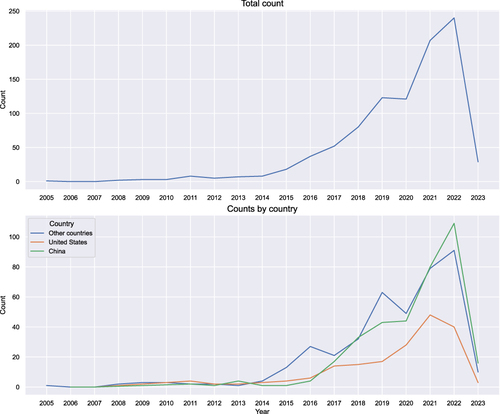
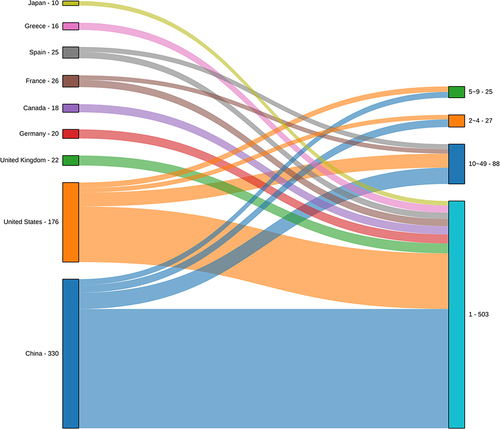
Figure 7 Sankey diagram from country to condition. The numbers after the country and condition names indicate the total number of outflow and inflow studies, respectively. For example, “China - 195” means that a total of 195 studies from China flowed to different condition nodes on the right side of the figure. Note that since the remaining nodes are filtered out, these numbers only represent the statistical association between the nodes displayed in the Sankey diagram.
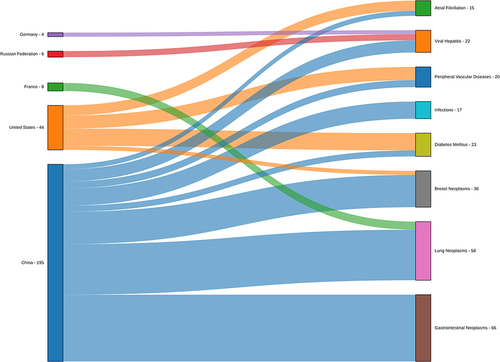
Figure 8 Sankey diagram from country to research center classification. Numerical research center variables are discretized into categorical variables with different intervals. The study centers were classified into five categories: “1”, “2~4”, “5~9”, “10~49”, and “≥50”. The category “≥50” is not displayed in the plot, as lines with node counts less than 10 are filtered out.