
Figures & data
Table 1 Baseline Characteristics of the 10 Paired Patients with HBeAg-Positive CHB Receiving 48 Weeks of PEG-IFN Monotherapy
Table 2 Baseline Characteristics of 27 Patients with HBeAg-Positive CHB Who Received PEG-IFN Monotherapy or PEG-IFN and Nucleos(t)ide Analog Combination Therapy
Figure 1 The dynamic levels of hepatitis B surface antigen (HBsAg), hepatitis B e antigen (HBeAg), hepatitis B virus (HBV) DNA, aminotransferase (ALT), aspartate aminotransferase (AST), and Albumin in the response and no response group among 10 paired patients with HBeAg-positive chronic hepatitis B receiving polyethylene glycol (PEG)ylated-interferon (PEG-IFN) monotherapy for 48 weeks.
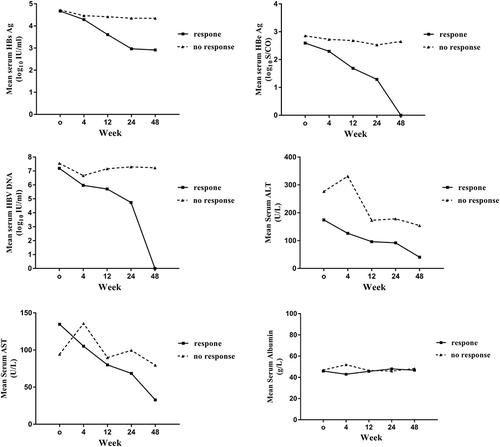
Figure 2 The detection rates of the 27 cytokines in the 10 paired patients with HBeAg-positive chronic hepatitis B receiving PEG-IFN monotherapy for 48 weeks.
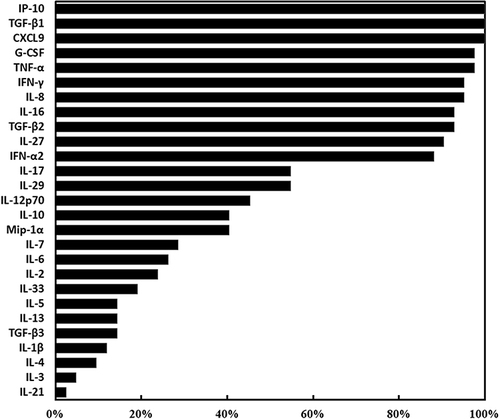
Figure 3 Six cytokines with significant differences between 10 paired patients with hepatitis B e antigen (HBeAg)-positive chronic hepatitis B (CHB) and healthy controls. *P < 0.05.
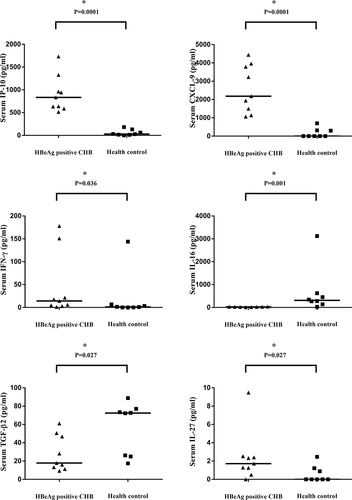
Figure 4 The levels of IL-27, TGF-β2, IL-16, IFN-γ, CXCL9, and IP-10 in virological responders and non-responders among 10 patients who were hepatitis B e antigen positive during PEG-IFN treatment.
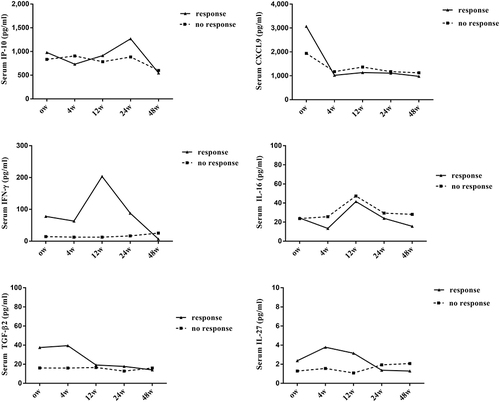
Figure 5 The levels of TGF-β1, G-CSF, TNFα, and IL-8 in virological responders and non-responders among 10 patients who were hepatitis B e antigen positive during PEG-IFN treatment.
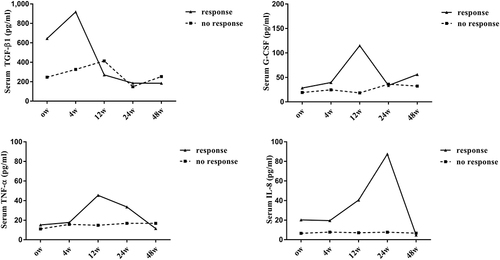
Figure 6 The heat map of eight highly expressed cytokines in the 37 patients at week 0 and week 12.
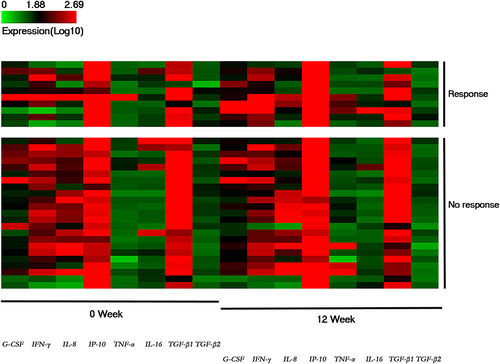
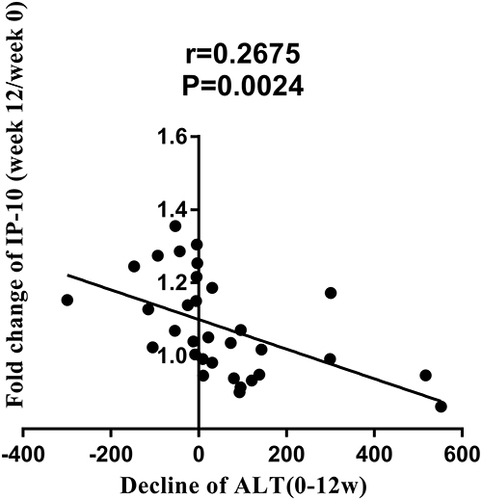
Figure 7 The correlation between the fold change in the C-X-C motif chemokine ligand 10 (IP-10) level from week 12 to week 0 and the decreasing aminotransferase (ALT) value week 0 to week 12.
Data Sharing Statement
The datasets used and/or analyzed during the current study are available from the corresponding author on reasonable request.