Figures & data
Figure 1 Flowchart of this study about constructing a circRNA/miRNA/mRNA network.
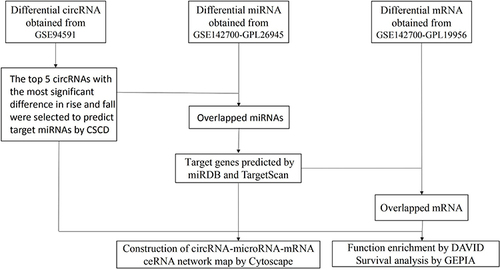
Table 1 Sequences of Primers for RT-qPCR and miRNA Related Sequence
Table 2 Basic Characteristics of These 10 circRNAs
Figure 2 Acquired DEcircRNAs of AML. (a) Volcano plots of DEcircRNAs, the blue dots and red dots represent down- and up-expressed circRNAs. (b) Heatmap of circRNAs. Type: (C) healthy controls. (T) AML patients.
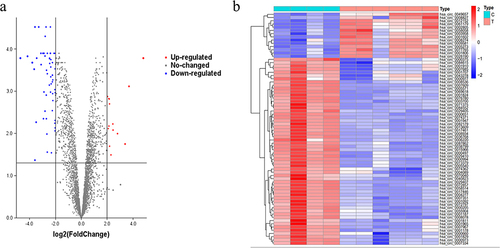
Figure 3 Differentially expressed miRNAs in AML patients. (a) Basic structures of the 10 circRNAs. (b) Volcano plots for differentially expressed miRNAs, the blue and red dots represent down- and up-expressed miRNAs. (c) Heatmap of differentially expressed miRNAs. Type: (C) healthy controls. (T) AML patients. (d) Venn graph showing the 6 overlapped genes by intersecting circRNA targeted genes and miRNA response elements from AML patients.
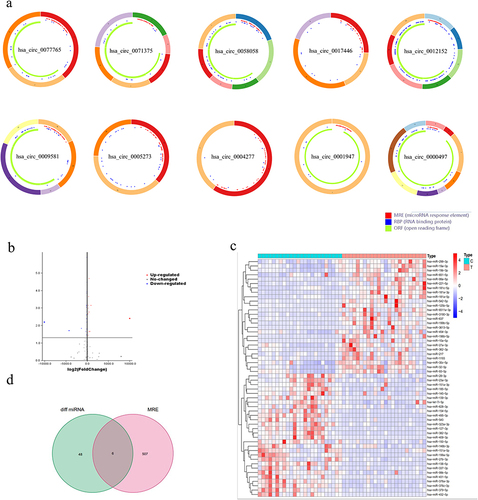
Figure 4 Differentially expressed mRNAs in AML patients. (a) Volcano plots of differentially expressed mRNAs, the blue and red dots represent down- and up-expressed miRNAs. (b) Heatmap for differentially expressed miRNAs. Type: (C) healthy controls. (T) AML patients. (c) Venn graph showing the 33 overlapped genes by intersecting the miRNA targeted genes and mRNA targets from AML patients.
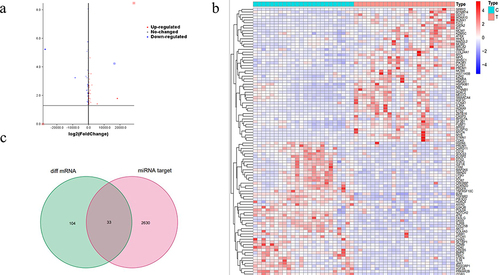
Figure 5 Dot plot of function enrichment analysis. (a) Biological process. (b) Cellular component. (c) Molecular function. (d) KEGG pathway.
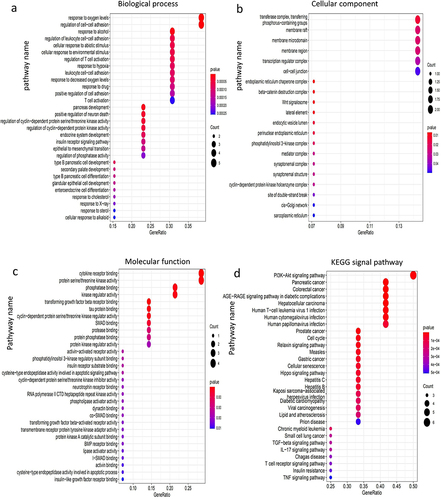
Figure 6 ceRNA network. circRNAs, and miRNAs, hub-genes are shown in purple, yellow, and red respectively. circRNAs: dark purple: rising, light purple: falling; miRNAs: dark yellow: rising, light yellow: falling; hub-genes: dark red: rising, light red: falling.
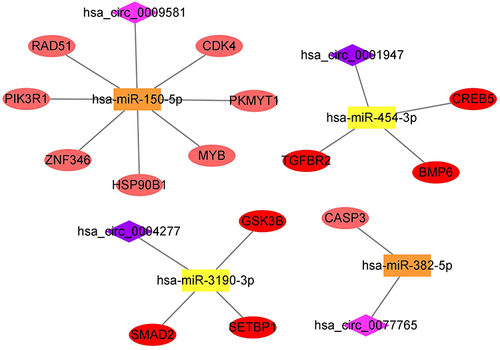
Figure 7 Survival analysis and validation of the 7 genes. (a) mRNA expression levels of 7 hub genes.*p<0.05. (b) The overall survival analysis of RAD51 related to AML patients. P < 0.05.
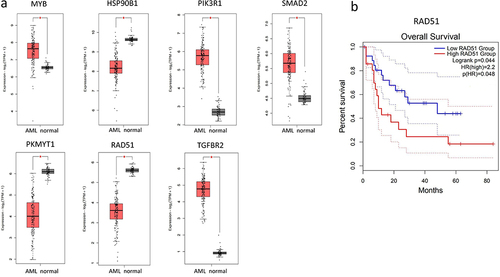
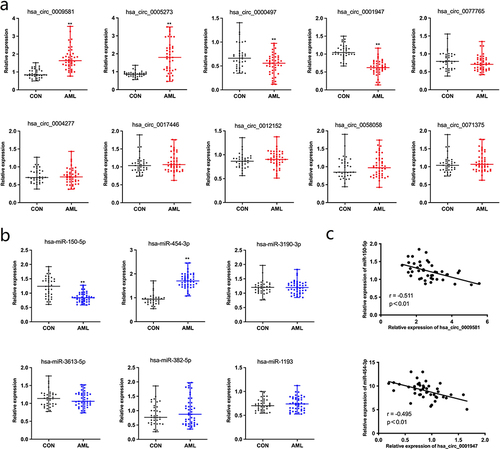
Figure 8 Quantitative real-time PCR results of circRNAs and miRNAs expression. (a): RT-qPCR of 10 circRNAs (b): RT-qPCR of 6 miRNAs. (c): Relationships of circRNAs and miRNAs. **p<0.05.