
Figures & data
Table 1 Baseline Demographics, Characteristics, and Comorbidities of the Subjects
Table 2 Correlations Between Serum Irisin, cTi Levels and QTc Interval
Figure 1 Serum irisin levels in control subjects and AMI patients (****p<0.0001m).
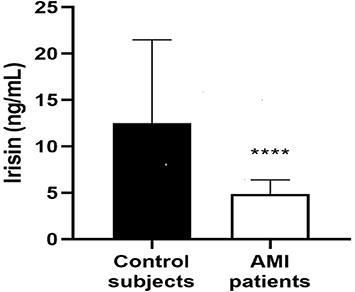
Table 3 Diagnostic Values of Irisin and Other Variables in All Groups
Figure 2 ROC analysis of irisin, peak cTi and QTc interval for STEMI variables and control groups.
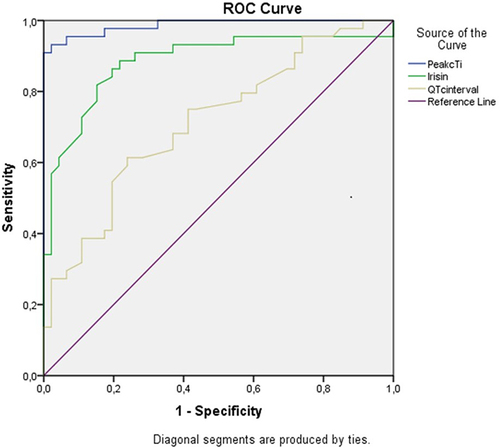
Table 4 Regression Analysis of Variables for STEMI