Figures & data
Table 1 Information on the Clinical Samples Used for the Microarray Study and RT-qPCR Validation Study
Figure 1 Principal component analysis (PCA) of miRNA expression data from human plasma exosomes. Red, SF; yellow, HC; green, SC; blue, SS.
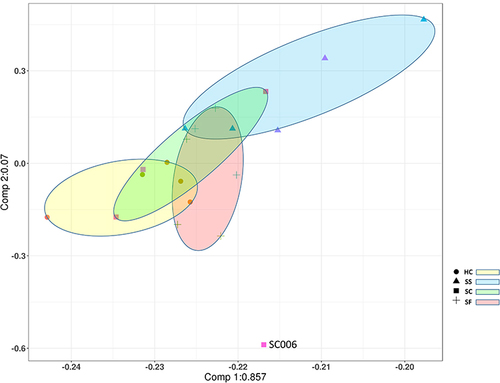
Figure 2 DEmiRNAs across different stages of syphilis. Changes in miRNA expression (|log2 ratio| ≥ 1.0, P < 0.05) are illustrated by volcano plot. Up-expressed miRNAs were shown as red dots, and down-expressed ones were marked as blue dots. (a) DEmiRNAs between HC compared with SF. (b) DEmiRNAs between SS compared with SF. (c) DEmiRNAs between SC compared with SF. (d) Number of DEmiRNAs corresponding to all groups. (e) Venn diagram of up-expressed miRNAs. (f) Venn diagram of down-expressed miRNAs. “A” represents DEmiRNAs in SS compared with HC. “B” represents DEmiRNAs in SC compared with HC. “C” represents DEmiRNAs in HC compared with SF in (a). “D” represents DEmiRNAs in SS compared with SC. “E” represents DEmiRNAs in SS compared with SF in (b). “F” represents DEmiRNAs in SC compared with SF in (c).
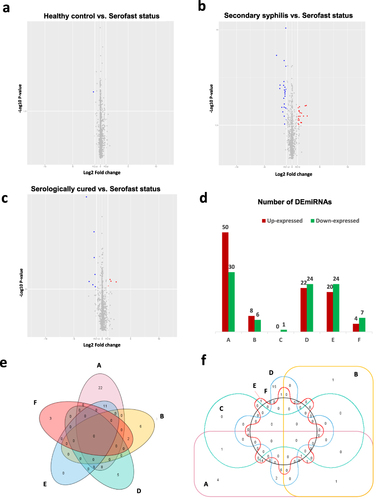
Figure 3 miRNA screening in SC, SF, and SS. Red boxes indicate up-regulated miRNAs, and blue boxes indicate down-regulated miRNAs. The brightness indicates the magnitude of the difference. Changes in miRNA expression (|log2 ratio| ≥ 1.0, P < 0.05) are illustrated by the heat map. MiRNAs and samples with similar expression are clustered together. (a) SS vs SF, (b) SC vs SF.
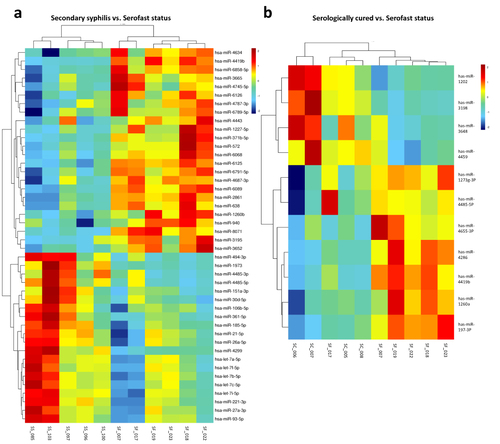
Figure 4 GO analysis of target genes of DEmiRNAs between SC and SF. (a) GO classification of target genes. (b) The top 30 most significantly enriched GO terms associated with target genes. Analysis Method: Fisher’s Exact Test (Precision Inspection), p-value < 0.05, q-value < 0.05, minimum difference count of 4.
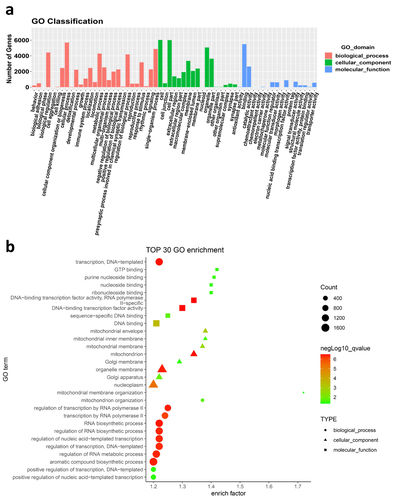
Figure 5 Pathway analysis of target genes of DEmiRNAs between SC and SF. (a) KEGG classification of target genes. (b) Pathways associated with target genes. Analysis Method: Fisher’s Exact Test (precision inspection), p-value < 0.05, with a minimum difference count of 4.
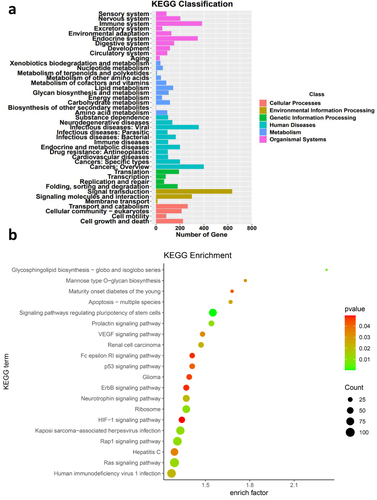
Figure 6 Detection of exosomes miRNAs of different groups by the RT-qPCR assay. The expression of four miRNAs was measured in 37 samples. Four miRNAs (miR-197-3p, miR-1273g-3p, miR-4485-5p, miR-1908-3p) were selected from the microarray data. Relative expression was used to normalize the gene expression data. U6 was set as the reference gene. Statistical analysis of the two groups was performed using Student’s t-test. *P < 0.05.
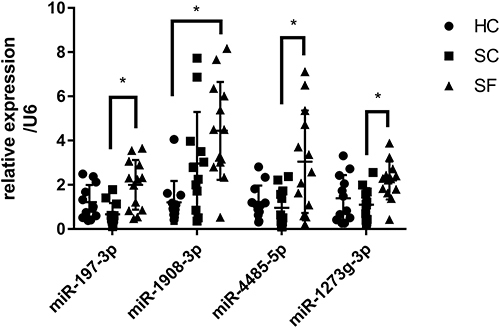
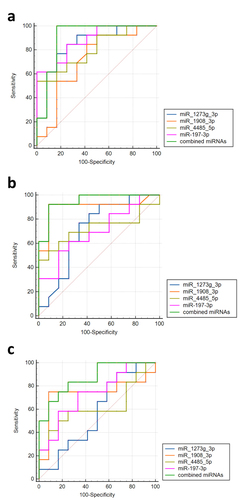
Table 2 Discrimination Power of Single or Multiple miRNAs in Syphilis
Figure 7 ROC curve analysis of single or multiple miRNAs evaluating the diagnostic value among different stages of syphilis. (a) SF vs HC. (b) SF vs SC. (c) SC vs HC.