
Figures & data
Figure 1 Flow chart of patient selection and follow up at 3 months.
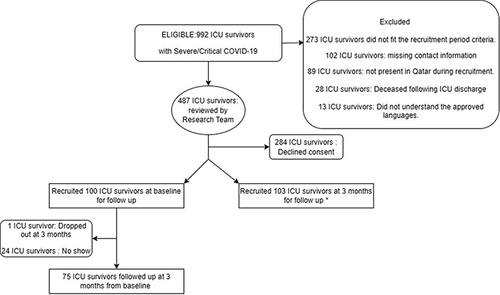
Table 1 Baseline Characteristics of Study Participants
Table 2 Mean Scores of SF-36 Domains at Baseline, 3 Months Period and Changes Overtime
Table 3 Lung Function: Average Measures and Percentage Predicted of FEV1, FVC, PEFR
Table 4 6-Minute Walk Test: Mean Values at Baseline and 3 Months Follow Up