Figures & data
Table 1 List of Primers
Figure 1 Alterations in CRGS enrichment scores for patients with different diseases. (a) t-Distributed stochastic neighbor embedding (t-SNE) plots colored by different sample groups. (b) Heatmaps showing the enrichment differences of six CRGSs per cell within different sample groups.
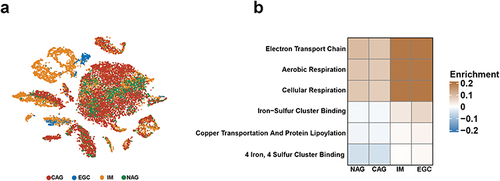
Figure 2 Identification of GC cuproptosis subtypes based on CRGS gene set scoring. (a) Unsupervised consensus clustering identified two GC cuproptosis clusters. (b–d) CDF curve, k-means algorithm and PCA showing the robustness and stability of the clustering. (e) Heatmap showing the CRGS enrichment pattern and clinical features of two cuproptosis subtypes. (f) Kaplan–Meier analysis of cuproptosis subtypes. Statistical significance: *P<0.05; ***P<0.001.
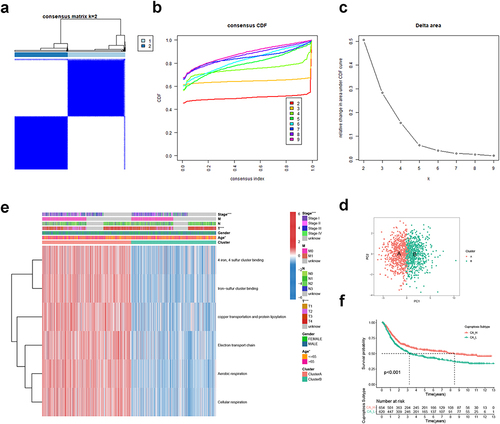
Figure 3 Biological function, TME score and immune cell infiltration analyses of GC cuproptosis subtyping system. GSEA functional analysis based on KEGG gene set for (a) CA-H patients and (b) CA-L patients. ssGSEA based on (c) Hallmark gene set and (d) Mariathasan gene set. Differences in (e) immune/stromal/ESTIMATE scores and (f) tumor purity between CA-H and CA-L subtypes. (g) Differences in immune cell infiltration between CA-H and CA-L subtypes. Statistical significance: *P<0.05; **P<0.01; ***P<0.001.
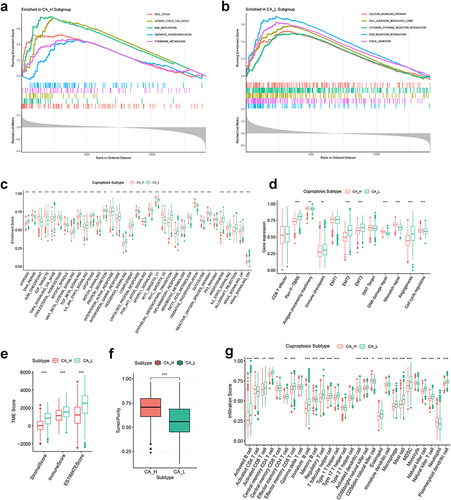
Figure 4 Identification of DEG subtypes. (a and b) KEGG and GO analysis for DEGs. (c) Heatmap showing the enrichment pattern of six CRGSs in two DEG subtypes. (d) Kaplan–Meier analysis of two DEG subtypes. (e and f) ssGSEA based on the Hallmark gene set and Mariathasan’s gene set. (g and h) Differences in immune/stromal/ESTIMATE scores and tumor purity between two DEG subtypes. (i) Differences in immune cell infiltration between two DEG subtypes. Statistical significance: **P<0.01; ***P<0.001.
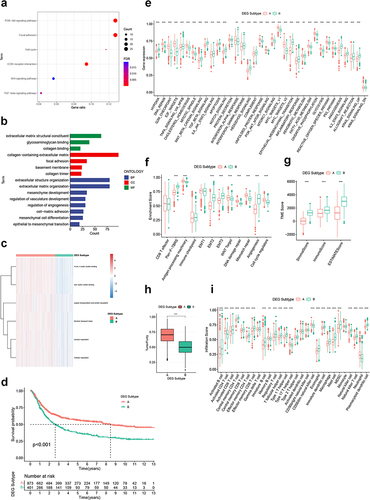
Figure 5 Construction of CRGS risk score signature in training cohort. (a) LASSO coefficients of prognosis-related DEGs. (b) Ten-fold cross-validation for tuning parameter selection in the LASSO model. (c) Waterfall plot showing distributions of cuproptosis subtype and DEG subtype in high and low CRGS risk score groups. Risk score differences between (d) two cuproptosis subtypes and (e) two DEG subtypes. (f) Risk score distribution curve. The blue line represents risk scores for low-risk patients; the red line represents risk scores for high-risk patients. (g) Scatter plot showing the relationship between survival status and risk score. The horizontal ordinate represents the number of patients; the vertical ordinate represents the risk score. (h) Heatmap comparing the enrichment differences of six CRGSs between high- and low-risk patients. (i) Kaplan–Meier analysis for high- and low-risk patients. (j) ROC curve for predicting 1-, 3- and 5-year OS of the CRGS risk score model. Statistical significance: ***P<0.001.
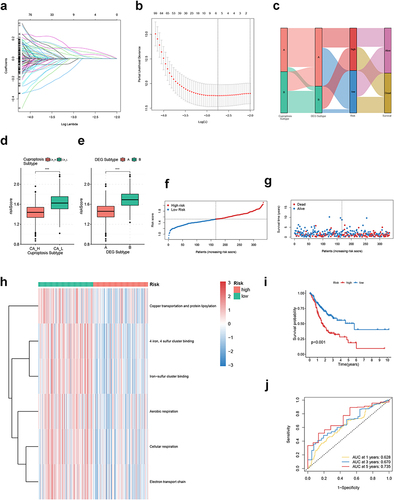
Figure 6 Biological function and TME landscape analysis of CRGS risk score signature in the training cohort. (a) Hallmark ssGSEA for high- and low-risk patients. (b and c) Differences in immune/stromal/ESTIMATE scores and tumor purity between high- and low-risk patients. (d) Differences in immune cell infiltration between high- and low-risk patients. Statistical significance: *P<0.05; **P<0.01; ***P<0.001.
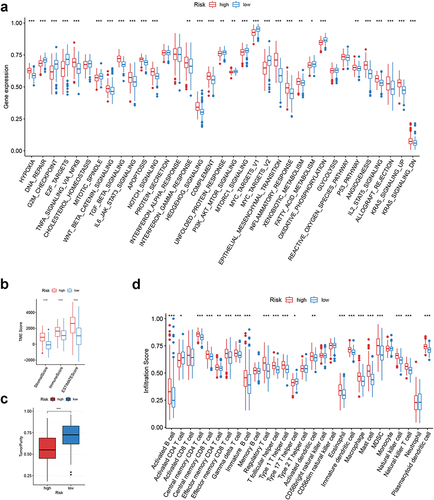
Figure 7 Clinical correlation analysis of CRGS risk score signature in the ACRG cohort (GSE62254). (a) Bar plots showing the frequencies of different clinical features in high- and low-risk patients. (b) Boxplots showing risk score differences in different T status, N status, M status, tumor stage and recurrence status subgroups. Statistical significance: *P<0.05; **P<0.01; ***P<0.001.
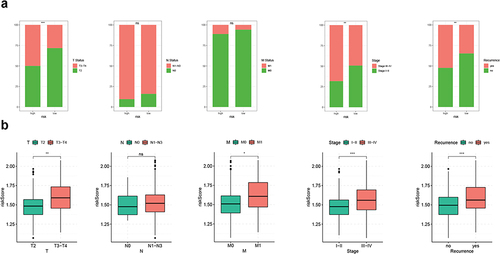
Figure 8 Somatic variation analysis of CRGS risk score signature. (a) Boxplot showing the difference in TMB between high- and low-risk patients. (b) Spearman correlation analysis of TMB and the risk score. (c and d) Waterfall plots depicting the gene mutation landscape of the top 20 most frequently mutated genes in GC in high- and low-risk patients. Each column represents an individual patient. The upper bar plot shows TMB. The percentage on the right represents the mutation frequency of each gene. The right bar plot shows the frequency of each mutation type. (e) Kaplan–Meier curves for high- and low-TMB GC patients. (f) Kaplan–Meier curves of patients stratified by both TMB and risk level. Statistical significance: ***P<0.001.
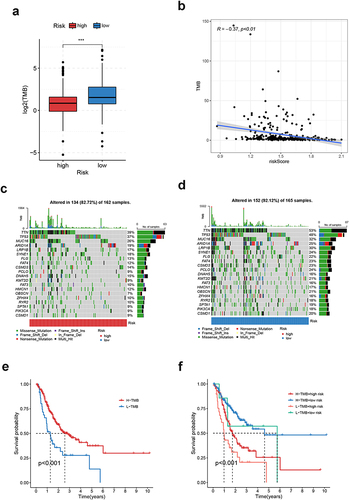
Figure 9 Immunotherapeutic sensitivity analysis of CRGS risk score signature. (a–c) Bar plots showing IPS differences for ICB treatment between high- and low-risk groups in TCGA cohort. Boxplots showing differences in TIDE scoring between high- and low-risk patients in (d) meta-cohort, (e) TCGA cohort, (f) GSE62254, (g) Lei cohort and (h) GSE84437. (i and j) Kaplan–Meier plots for high- and low-risk patients in IMvigor210 and Braun’s cohort. Statistical significance: ***P<0.001.
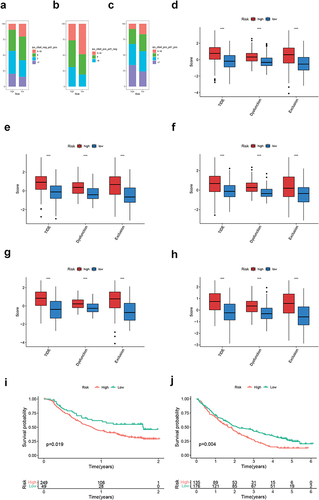
Figure 10 Chemotherapeutic sensitivity analysis of CRGS risk score signature. Kaplan–Meier plots showing the impact of chemotherapy on patients’ (a) overall survival and (b) disease-free survival in GSE62254. Boxplots showing IC50 differences for 5-fluorouracil, methotrexate, cisplatin, doxorubicin, vinblastine and paclitaxel between high- and low-risk patients in (c) meta-cohort, (d) TCGA cohort, (e) GSE62254, (f) Lei cohort and (g) GSE84437. Statistical significance: *P<0.05; **P<0.01; ***P<0.001.
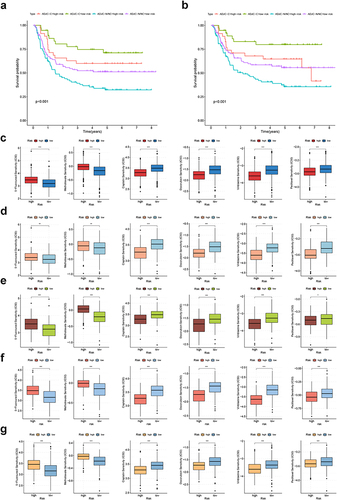
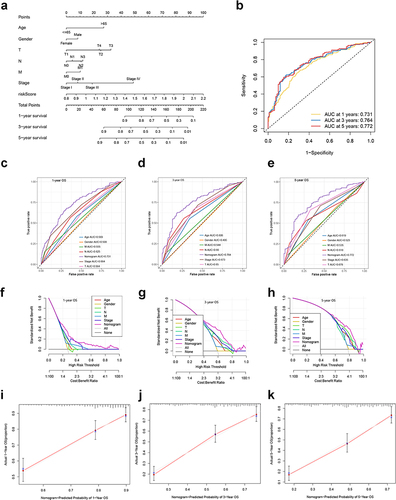
Figure 11 Development and validation of a nomogram based on the CRGS risk score signature. (a) Nomogram integrating risk score, age, gender, T, N, M status and tumor stage for predicting 1-, 3- and 5-year OS. (b) Time-dependent ROC curve of the nomogram for predicting 1-, 3- and 5-year OS. (c–e) Time‐dependent ROC curves evaluating the efficacy of the nomogram to predict 1-, 3- and 5-year OS, compared with other factors, including age, gender, T, N, M status and tumor stage. (f–h) DCA curves estimating the predictive efficacy of the nomogram from the perspective of clinical benefit. The y-axis refers to the net benefit. The x-axis refers to the predicted OS. The black line represents the hypothesis that all patients survive for 5 years. The gray line represents the hypothesis that no patients stay alive for more than one year. (i–k) Calibration curves of the nomogram for predicting 1-, 3- and 5-year OS. The gray lines represent the ideal predictive model and the red lines represent the observed model.