
Figures & data
Figure 1 Lymphocyte gating with CD3+ T-cells and subdivided T helper CD4+ and cytotoxic CD8+ cells.
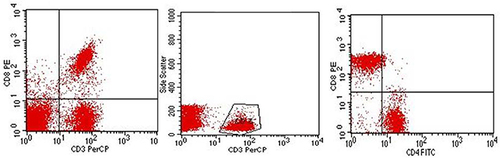
Table 1 Clinical and Imaging Characteristics of the Included HCC and Liver Cirrhosis Patients
Table 2 Routine Laboratory Data of the Study Groups
Table 3 Immunological Data of the Study Groups (All Data are Presented as Percentage)
Figure 2 Monocyte subsets (classical, intermediate, and non-classical monocytes) on gated monocytes. The upper part of the figure shows marked increase in non-classical monocytes. The lower part of the figure shows decreased intermediate and absent non-classical monocytes.
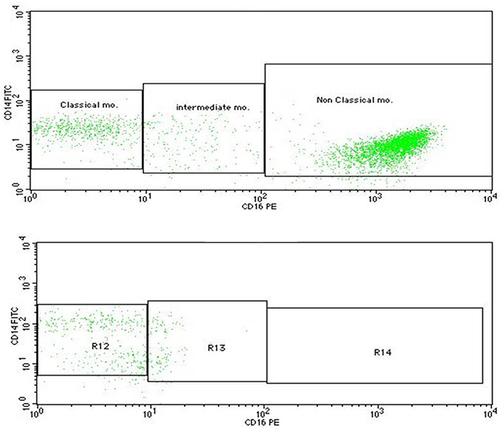
Table 4 Immunological Data of the Different Barcelona Clinic Liver Cancer (BCLC) Scoring Systems of HCC (All Data are Presented as Percentage)
Table 5 Immunological Data of the Different TNM Scoring Systems of HCC (All Data are Presented as Percentage)