Figures & data
Table 1 Baseline Characteristics of the Study Population
Figure 1 Inclusion and exclusion criteria process.
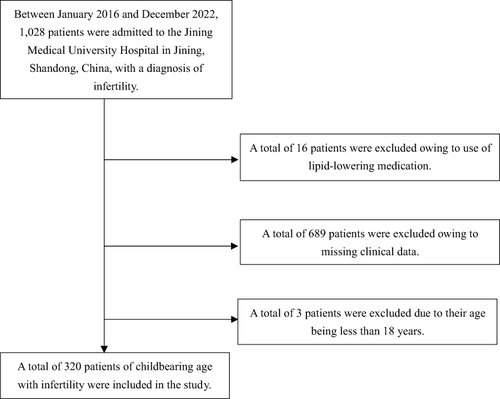
Table 2 Univariate Analysis of PLR
Table 3 Relationship Between NLR and PLR in Different Models
Table 4 Threshold Effect Analysis of the Relationship Between NLR and PLR
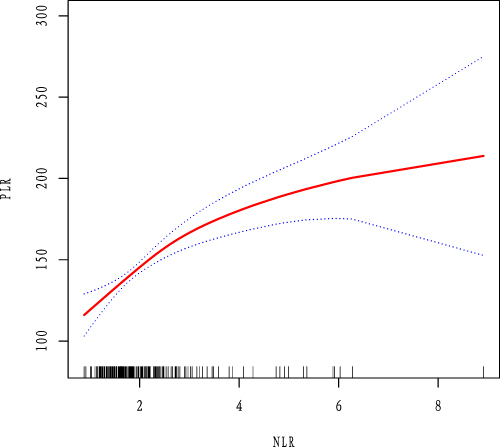
Figure 2 Association between NLR and PLR in the total study population (mmol/L). Figure 2 shows the smooth fitting curve of NLR and PLR. The solid red line represents the smooth curve fit between the variables. Blue bands represent the 95% confidence interval of the fit. The model was adjusted for age.
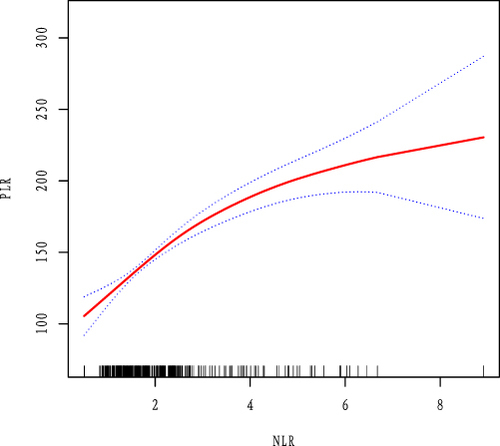
Figure 3 Association between NLR and PLR in the Low-BMI group study population (mmol/L). Figure 3 shows the smooth fitting curve of NLR and PLR. The solid red line represents the smooth curve fit between the variables. Blue bands represent the 95% confidence interval of the fit. The model was adjusted for age.
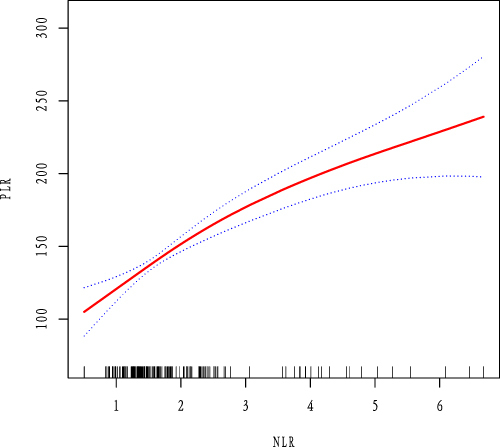
Figure 4 Association between NLR and PLR in the High-BMI group study population (mmol/L). Figure 4 shows the smooth fitting curve of NLR and PLR. The solid red line represents the smooth curve fit between the variables. Blue bands represent the 95% confidence interval of the fit. The model was adjusted for age.